Development profiling: Difference between revisions
Jump to navigation
Jump to search
(Created page with "== Profiling frame rate == There is a built-in graph for visualizing the frame rate of the renderer which can be useful for debugging and profiling purposes. File:Fps-grap...") |
(No difference)
|
Revision as of 16:12, 15 March 2021
Profiling frame rate
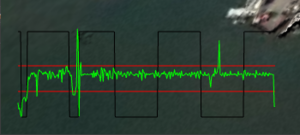
There is a built-in graph for visualizing the frame rate of the renderer which can be useful for debugging and profiling purposes.
This graph can be enabled through the interface `TPG.GeoFramework.NativeLayerBridge.ContractsIMapInterfacer` for 2D map display, and `TPG.GeoFramework.NativeLayerBridge3D.Contracts.IMap3DInterfacer` for 3D displays. Both these interfaces has a boolean property called `ShowPerformanceGraphs` to enable/disable the graph.
