Heat map
General
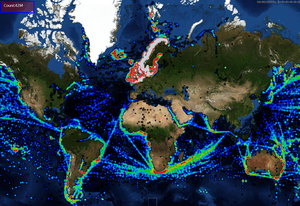
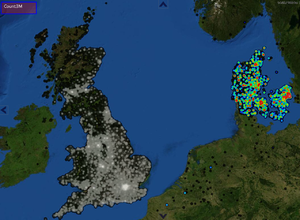
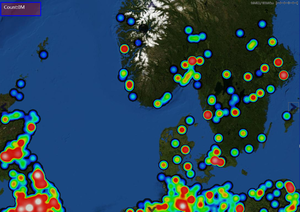
Heat maps are typically used to indicate density of data points geographically using color coding. They can be used to visualise large amounts of point data in 2D.
Examples include:
- Historical positions
- Population densities
- Frequency of events
https://en.wikipedia.org/wiki/Heat_map
Typically, bright or "hot" colors are used to indicate high level of activity or denser areas while "cooler" colors are used to indicate lower levels of activity. Several different palettes can be used for heatmaps. Some examples can be found here: https://www.andrewnoske.com/wiki/Code_-_heatmaps_and_color_gradients
Heat map generation
Geographical heat map generation follows the following general steps:
- For a given view, a set of possibly weighted positions are extracted
- Weights/counts are accumulated in a raster
- Some heat map kernel is applied to smooth and spread measurements
- Color is applied
Heat maps in GDK
Maria GDK provides an optimised engine for generating heatmaps for large amounts of geographical data, up to around 100 million points can be processed with acceptable performance. Parameters can be changed interactively with the heat map display changing nearly instantly.
IHeatMapLayerViewModel exposes the heat map API:
namespace TPG.GeoFramework.HeatMapLayer
{
    /// <summary>
    /// View model for general heat maps
    /// </summary>
    public interface IHeatMapLayerViewModel:IGeoLayerViewModel
    {
        /// <summary>
        /// Heat map data is organized in HeatMapGroups. Each group contains clusters of heat map data.
        /// Separate settings and color palettes can be set for each group.
        /// Note that the heat map property setters are applied to both default settings and to all groups.
        /// For detailed, individual group settings control, access elements in the HeatMapGroups directly
        /// </summary>
        ObservableCollection<HeatMapGroup> HeatMapGroups { get; }

        /// <summary>
        /// HeatMapSettings contain global settings and a default group setting that
        /// is used when no settings are available for a heat map group.
        /// </summary>
        HeatMapSettings HeatMapSettings { get; }

        /// <summary>
        /// Sets kernel radius unit (meters or pixels)
        /// </summary>
        KernelRadiusUnitEnum KernelRadiusUnit { get; set; }

        /// <summary>
        /// Kernel radius, unit controlled by KernelRadiusUnit
        /// </summary>
        double KernelRadius { get; set; }

        /// <summary>
        /// Sets kernel shape. The kernel shape controls how values are smoothed in the HeatMap.
        /// See https://en.wikipedia.org/wiki/Kernel_(statistics)#Kernel_functions_in_common_use
        /// </summary>
        KernelShapeEnum KernelShape { get; set; }

        /// <summary>
        /// Max pixel radius used when applying kernel. This is relevant when setting the kernel unit to "meters"
        /// and is used to limit demanding calculations
        /// </summary>
        double MaxPixelRadius { get; set; }

        /// <summary>
        /// Multiplier is applied to all values prior to applying the kernel
        /// </summary>
        double ValueScale { get; set; }

        /// <summary>
        /// Smaller grid cell sizes yield higher quality heat maps. Larger grid cell sizes are quicker. Typical range is 1-10.
        /// </summary>
        int GridCellSize { get; set; }
    }
}
Heat map settings
Heat map settings affects how the heat map is generated and displayed. IHeatMapLayerViewModel.HeatMapSettings control global settings and defaults. In addition, each HeatMapGroup contains an optional HeatMapGroupSettings
| Item | Description | Value type |
|---|---|---|
| HeatMapSettings.GridCellSize | Controls quality of grid display. Higher values will greatly boost performance, while sacrificing heatmap quality. A value of "1" creates the best heatmap visualisation. Default is "2", this creates high resolution heatmaps while preserving good performance. Typical range is 1-8. | int (Pixels) |
| HeatmapGroupSettings.KernelRadius | Controls the size (radius) of the heatmap measured from every data point | double (Value in Pixels or Meters, controlled by HeatmapGroupSettings.KernelRadiusUnit) |
| HeatmapGroupSettings.KernelRadiusUnit | Controls the unit type for HeatmapGroupSettings.KernelRadius | enum (Pixels or Meters) |
| HeatmapGroupSettings.KernelShape | Controls how point values are distributed across the heatmap radius. See https://en.wikipedia.org/wiki/Kernel_(statistics)#Kernel_functions_in_common_use | enum (Quartic, Triangular, Uniform, Triweight, Epanechnikov or Gaussian) |
| HeatmapGroupSettings.ValueScale | Can be used to compress or expand the values in the heatmap. Manipulating ValueScale can be used interactively to alter visuals without editing the color tables | double (Factor) |
| HeatmapGroupSettings.MaxPixelRadius | Limits the maximum number of pixels in the heatmap radius. When selecting RadiusType "Meters", setting this parameter will limit the maximum heatmap size when zooming in. This may prevent sluggish performance. | double (Pixels) |
Heat map colors
When defining heat map colors, each scalar value in the heat map raster must be associated with a color value. This is done by defining color groups that contain a list of colors and heatmap bounds, together defining color gradients for heat map values. Each HeatMapGroup contains a list of ColorGroup:
    public class HeatMapGroupSettings
    {
        ...
        /// <summary>
        /// The color groups control how color is applied to the heat map by associating heat map values with colors.
        /// The elements must be ordered by lowest values first
        /// </summary>
        public List<ColorGroup> Colors { get; set; }
        ...
     }
Note that the ColorGroup items in Colors must be ordered so that the first element contains the lowest boundary value, with increasing boundary values.
    /// <summary>
    /// Color groups are used to map from heat map values to colors. They are typically chained in a
    /// list of values, when the heat map value falls between the lower bound of one group and the
    /// lower bound of the next higher group, the color value is interpolated
    /// </summary>
    public class ColorGroup
    {
        /// <summary>
        /// Color group is valid if heat map value is between LowerBound and LowerBound of next group
        /// If the heat map value is larger than the last/largest color group, the last group is valid
        /// </summary>
        public double LowerBound { get; set; }

        /// <summary>
        /// Lower bound color. If the heat map value is equal to or slightly above LowerBound,
        /// ArgbLowerBoundColor is used. The format matches low level pixel format, use ToRaw to create
        /// color values
        /// </summary>
        public UInt32 ArgbLowerBoundColor { get; set; }

        /// <summary>
        /// Optional upper bound color. If not set, the lower bound color from the next group is used
        /// Note: By setting this value to the same as ArgbLowerBoundColor, it is possible to create non-smoothed
        /// heatmaps. Otherwise, colors will be automatically smoothed
        /// </summary>
        public UInt32? ArgbUpperBoundColor { get; set; }

        /// <summary>
        /// Utility function to create raw ARGB-values used in ColorGroup
        /// </summary>
        /// <param name="r">Red component (0-255)</param>
        /// <param name="g">Green component (0-255)</param>
        /// <param name="b">Blue component (0-255)</param>
        /// <param name="a">Alpha/transparency (0-255) 0 is fully transparent, 255 is fully opaque</param>
        /// <returns></returns>
        public static UInt32 ToRaw(byte r, byte g, byte b, byte a)
        {
            if (a < 255)
                return ColorUtils.PremultiplyAlpha((UInt32) (a << 24 | r << 16 | g << 8 | b));
            return (UInt32) (a << 24 | r << 16 | g << 8 | b);
        }
    }
Standard colors
Maria GDK defines several default heat map colorings. They can be defined like this:
Settings.Colors = HeatMapColors.GetStandardColors(alpha, 0.1, 10, 50, 100, 200, 400, 8000);
Settings.Colors = HeatMapColors.GetGreyscaleColors(alpha, 0.1, 200, 8000);
Settings.Colors = HeatMapColors.GetBlueGreenColors(alpha, 0.1, 10, 100, 8000);
The values in the color Get-helpers are the heat map lower boundary values. Note that very large numbers are chosen for the final value in order to allow some color variations for high heat map values. The colors are defined here: http://www.andrewnoske.com/wiki/Code_-_heatmaps_and_color_gradients
Note that by default, GetStandardColors is used to generate heat map colors.
Use lower threshold values to get more distinct coloring (if the results appear mostly black), use higher values for very dense data to avoid white-outs.
Custom colors
Any legal colors can be used for coloring heat maps. Care should be taken to create a palette and boundary values that are suited for visualising the data that are being processed. It is not possible to create universal defaults as data ranges, dynamics, values of interest and so on can vary extremely much between data sets and data domains.
The example below illustrates how the default grey scale palette is created:
     public static List<ColorGroup> GetGreyscaleColors(byte alpha, double v1, double v2, double v3)
     {
         // http://www.andrewnoske.com/wiki/Code_-_heatmaps_and_color_gradients
         var colors = new List<ColorGroup>();
         colors.Add(new ColorGroup
         {
             ArgbLowerBoundColor = ColorGroup.ToRaw(0, 0, 0, alpha),
             LowerBound = v1,
         });
         colors.Add(new ColorGroup
         {
             ArgbLowerBoundColor = ColorGroup.ToRaw(128, 128, 128, alpha),
             LowerBound = v2,
         });
         colors.Add(new ColorGroup
         {
             ArgbLowerBoundColor = ColorGroup.ToRaw(255, 255, 255, alpha),
             LowerBound = v3,
         });
         return colors;
     }
Custom grey scale palettes can add more color groups than the default in order to emphasize different data ranges. While linear interpolation is used when resolving colors from the heat map, it is possible to emulate more complex functions by adding piecewise linear boundary ranges colors.
Weighted positions
When adding geographical data to a heat map item, it is possible to add explicit weights or values for each position individually or for the entire position list. Note that the value array must either be empty or have one value for each position, or the constructor will throw an exception.
The HeatMapGeoData constructor allows individual values for all data points:
        /// <summary>
        /// Initialise constructor with initial positions
        /// </summary>
        /// <param name="positions">Geographical positions</param>
        /// <param name="values">Optional array with values, must be either null or one for each position</param>
        public HeatMapGeoData(GeoPos[] positions, double[] values = null)
By setting the HeatMapGeoData.DefaultValue, all positions are automatically assigned this weight/value unless explicit values are set in the constructor.
        /// <summary>
        /// All data points will be assigned the default value if no explicit values are assigned
        /// for each position. Default is 1.0
        /// </summary>
        public double DefaultValue { get; set; }
In addition, it is possible to add positions and values after construction. Note that if "values" is set and values were not set for previously existing positions, existing positions will be set to DefaultValue and new positions will be assigned supplied values.
        /// <summary>
        /// Add positions and optionally values to heat map geo data
        /// </summary>
        /// <param name="positions">Geographical positions</param>
        /// <param name="values">Optional array with values, must be either null or one for each position</param>
        public void AddItems(GeoPos[] positions, double[] values=null)
Multiple heat map groups
It is possible to add multiple heat map groups to IHeatMapLayerViewModel.HeatMapGroups. Each group can have different settings and different colors. The first group is rendered first, so that later groups may overlap previous groups. Note that care should be taken to keep the group count relatively low as there is significant overhead for each group added. Also note that all groups share the same GridSize. Example: Each group of POIs belong to different heat map groups and have different colorings.
Adding heat maps
Positions are added using IHeatMapLayerViewModel.HeatMapGroups. The sample below contains code from NGTester used to load heat map data from file.
// Add raw positions as heatmap using default settings:
heatMapVm.HeatMapGroups.Add(HeatMapFileLoader.LoadHeatMapGroup("some_test_data.geo"));

// Add heat map data with palette and settings:
heatMapVm.HeatMapGroups.Add(HeatMapFileLoader.LoadHeatMapGroup("some_test_data.heatmap"));
Alternatively, the protobuf can be decoded directly and made into a HeatMapGroup like this:
var hmd = HeatMapData.Parser.ParseFrom(stream);
if (hmd != null)
	HeatMapGroup hmg=HeatMapDataProtoConverter.HeatMapDataToHeatMapGroup(hmd);
or
var pgc  = PositionGroupCollection.Parser.ParseFrom(stream);
if (pgc != null)
	HeatMapGroup hmg=HeatMapDataProtoConverter.PositionGroupToHeatMapGroup(pgc);
Heat map protobuf format
The data formats are defined using protobuf. The file should contain a single, serialized HeatMapData (below) for ".heatmap" type files, and a single PositionGroupCollection for ".geo" type files. Heatmap properties mirror those documented in the programmatic interfaces earlier.
syntax="proto3";
package TPG.GeoFramework.HeatMapCore.Proto;

message Position
{
	double lat=1;
	double lon=2;
}

message PositionGroup
{
	string Name=1;
	repeated Position Positions=2;
	repeated double PositionValues=3;
}

message PositionGroupCollection
{
	string Name=1;
	repeated PositionGroup PositionGroups=2;
}

message HeatMapDataSettings
{
	message ColorGroup
	{
		double LowerBound = 1;
		uint32 ArgbLowerBoundColor = 2;
		bool HasArgbUpperBoundColor = 3;
		uint32 ArgbUpperBoundColor = 4;
	}

	enum KernelShapeEnum
	{
		Default = 0;
		Quartic = 1;
		Triangular = 2;
		Uniform = 3;
		Triweight = 4;
		Epanechnikov = 5;
		Gaussian = 6;
	}

	enum KernelRadiusUnitEnum
	{
		Pixels = 0;
		Meters = 1;
	}

	double KernelRadius = 1;
	KernelRadiusUnitEnum KernelRadiusUnit = 2;
	KernelShapeEnum KernelShape = 3;

	repeated ColorGroup Colors = 10;
}

message HeatMapData
{
	string Name=1;
	string Id=2;
	HeatMapDataSettings Settings = 3;
	repeated PositionGroup PositionGroups=4;
}


