Comparing compression in different formats: Difference between revisions
(→�) |
(→�) |
||
| (22 intermediate revisions by the same user not shown) | |||
| Line 31: | Line 31: | ||
|} | |} | ||
The compressed ECW images were created with FME 2021.2. | The compressed ECW images were created with FME 2021.2. Note that FME and GeoCompressor uses slightly different parameter for compression rate: FME uses percentage of uncompressed size, while GeoCompressor uses the denominator in a fraction. For example : | ||
{| class="wikitable" | |||
!Compress by % (FME) | |||
!Target rate (GeoCompressor) | |||
|- | |||
| 93 || 15 | |||
|- | |||
| 95 || 20 | |||
|- | |||
| 97.2 || 35 | |||
|- | |||
| 98 || 50 | |||
|- | |||
| 98.6 || 70 | |||
|- | |||
| 98.8 || 80 | |||
|- | |||
|99 | |||
|100 | |||
|} | |||
JPEG and WEBP were used as tile formats in GeoPackage datasets, with overviews. These were created with ''gdal_translate'' and ''gdaladdo'' version 3.4.1 | JPEG and WEBP were used as tile formats in GeoPackage datasets, with overviews. These were created with ''gdal_translate'' and ''gdaladdo'' version 3.4.1 | ||
== | == Plots == | ||
The results are plotted with file size on the x-axis and SSIM on the y-axis. Each data point is a file with the input quality parameter labelled. | The results are plotted with file size on the x-axis and SSIM on the y-axis. Each data point is a file with the input quality parameter labelled. | ||
The graph shows that at high compression/low SSIM, the ECW format is easily the most effective. However, as SSIM increases, the three formats converge, and at around SSIM=0.9 the formats produce equally sized files. As can be seen in the image comparison, even though the SSIM is equal, the images does not look the same. The different compression techniques results in different visual distortions, but in total, it amounts to the same difference from the baseline image. | The graph shows that at high compression/low SSIM, the ECW format is easily the most effective. However, as SSIM increases, the three formats converge, and at around SSIM=0.9 the formats produce equally sized files. As can be seen in the image comparison, even though the SSIM is equal, the images does not look the same. The different compression techniques results in different visual distortions, but in total, it amounts to the same difference from the baseline image. | ||
[[File:All methods ssim comparison plot.png|frame|File size against SSIM. Quality parameter is labeled on each data point. ]] | === Comparing formats at all compression levels === | ||
[[File:All methods ssim comparison plot.png|frame|File size against SSIM. Quality parameter is labeled on each data point. |none]] | |||
=== Comparing formats at | |||
<gallery mode="slideshow"> | === Comparing formats at very high compression levels === | ||
[[File:Ecw webp jpeg highcompression ssim comparison plot.png|none|frame|Detailed comparison of the formats at their maximum compression values.]] | |||
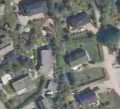
== Image comparisons == | |||
<gallery mode="slideshow" caption="SSIM 0.9"> | |||
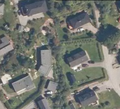
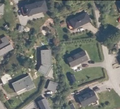
File:Baseline image.png|Uncompressed baseline image | |||
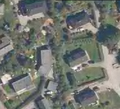
File:Ecw ssim09 q95.png|ECW quality 95 | |||
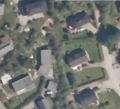
File:Webp ssim09 q35.png|WEBP quality 35 | |||
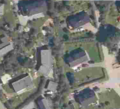
File:Jpeg ssim09 q25.png|JPEG quality 25 | |||
</gallery> | |||
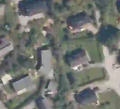
<gallery mode="slideshow" caption="SSIM 0.77"> | |||
File:Baseline image.png|Uncompressed baseline image | |||
File:Ecw ssim077 q986.png|ECW quality 98.6 | |||
File:Webp ssim077 q05.png|WEBP quality 5 | |||
File:Jpeg ssim077 q10.png|JPEG quality 10 | |||
</gallery> | </gallery> | ||
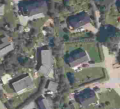
<gallery mode="slideshow" caption="Max compression"> | |||
<gallery mode="slideshow"> | File:Ecw q99.png|ECW quality 99 | ||
File:Webp q0.png|WEBP quality 0 | |||
File:Jpeg q10 corrected.png|JPEG quality 10 | |||
File:Baseline image.png|Uncompressed baseline image | |||
</gallery> | </gallery> | ||
| Line 65: | Line 95: | ||
Image:Ecw q90.png|ECW quality 90 | Image:Ecw q90.png|ECW quality 90 | ||
</gallery> | </gallery> | ||
== Comparing GeoPackage to Cloud Optimized GeoTIFF == | |||
We compare the formats GeoPackage with Cloud Optimized GeoTIFF (COG) Comparisons are done for compression methods WEBP and JPEG, at various quality levels. The source data is a high quality imagery ECW dataset with size 60000x60000 px. Efforts were made to use identical parameters when converting from the source dataset. The result looks almost identical at the highest zoom level, but diverge as zoom level decreases. The COG datasets have a higher apparent quality on lower zoom levels - this is probably because overviews are generated along with the main dataset in a single process. Each overview level is generated based on the source dataset. For GeoPackage, the overview levels are generated in a separate process, and are based on the already compressed main level in the GeoPackage (using first gdalwarp and then gdaladdo). | |||
[[File:GPKG-COG-WEBP Quality vs size comparison.png|800x800px]][[File:GPKG-VS-COG-JPEG Quality vs size comparison.png|frameless|800x800px]] | |||
The results show that there is an offset in size between the two format which remains approximately constant as quality levels varies. | |||
[[Category:Preparing data]] | |||
Latest revision as of 13:34, 23 April 2026
This is a comparison of a small selection of compression methods used in georeferenced raster imagery. We compare the formats
- ECW
- WEBP (as tile format in GeoPackage)
- JPEG (as tile format in GeoPackage)
The intention is to find which method gives the best percieved quality for the smallest file size. The measure for quality is SSIM - structural similarity index , which is a perception-based model to calculate the difference between two images.
Method

We compare a lossless baseline image to a compressed dataset, and measure the SSIM using Python package scikit-image. This is repeated with a range of quality values for the compressed images. This should give an indication of which method is most efficient. In addition, it will indicate the quality value which will achieve the same SSIM across the compression methods.
Note that each of the file formats use a different scale for the input "quality" parameter. We include a wide range of the legal values from each of the formats, so this difference should not matter.
The baseline image has the following attributes:
| Attribute | Value |
|---|---|
| File size | 273 MB |
| Format | GeoTIFF |
| Compression | LZW |
| Dimensions | 10000 x 10000 px |
| Pixel size | 0.25 meters |
The compressed ECW images were created with FME 2021.2. Note that FME and GeoCompressor uses slightly different parameter for compression rate: FME uses percentage of uncompressed size, while GeoCompressor uses the denominator in a fraction. For example :
| Compress by % (FME) | Target rate (GeoCompressor) |
|---|---|
| 93 | 15 |
| 95 | 20 |
| 97.2 | 35 |
| 98 | 50 |
| 98.6 | 70 |
| 98.8 | 80 |
| 99 | 100 |
JPEG and WEBP were used as tile formats in GeoPackage datasets, with overviews. These were created with gdal_translate and gdaladdo version 3.4.1
Plots
The results are plotted with file size on the x-axis and SSIM on the y-axis. Each data point is a file with the input quality parameter labelled.
The graph shows that at high compression/low SSIM, the ECW format is easily the most effective. However, as SSIM increases, the three formats converge, and at around SSIM=0.9 the formats produce equally sized files. As can be seen in the image comparison, even though the SSIM is equal, the images does not look the same. The different compression techniques results in different visual distortions, but in total, it amounts to the same difference from the baseline image.
Comparing formats at all compression levels

Comparing formats at very high compression levels

Image comparisons
- SSIM 0.9

Uncompressed baseline image
ECW quality 95

WEBP quality 35

JPEG quality 25


- SSIM 0.77
Uncompressed baseline image
ECW quality 98.6
WEBP quality 5
JPEG quality 10


- Max compression
ECW quality 99
WEBP quality 0
JPEG quality 10
Uncompressed baseline image


Comparing ECW q89 to q90
The ECW format has an interesting rise in SSIM from q90 to q89. Comparing the two images, it seems that significant noise is introduced at q90. File size does not change much.
Uncompressed baseline image
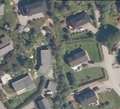
ECW quality 89
ECW quality 90


Comparing GeoPackage to Cloud Optimized GeoTIFF
We compare the formats GeoPackage with Cloud Optimized GeoTIFF (COG) Comparisons are done for compression methods WEBP and JPEG, at various quality levels. The source data is a high quality imagery ECW dataset with size 60000x60000 px. Efforts were made to use identical parameters when converting from the source dataset. The result looks almost identical at the highest zoom level, but diverge as zoom level decreases. The COG datasets have a higher apparent quality on lower zoom levels - this is probably because overviews are generated along with the main dataset in a single process. Each overview level is generated based on the source dataset. For GeoPackage, the overview levels are generated in a separate process, and are based on the already compressed main level in the GeoPackage (using first gdalwarp and then gdaladdo).


The results show that there is an offset in size between the two format which remains approximately constant as quality levels varies.