Category:Heat Map: Difference between revisions
(→�) |
(→�) |
||
| Line 130: | Line 130: | ||
=== Heat map settings === | === Heat map settings === | ||
Heat map settings affects how the heat map is generated and displayed. '''IHeatMapLayerViewModel.HeatMapSettings''' control global settings and defaults. In addition, each '''HeatMapGroup''' contains an optional '''HeatMapGroupSettings''' | |||
{| class="wikitable" | |||
|HeatMapSettings.GridCellSize | |||
|Controls quality of grid display. Higher values will greatly boost performance, while sacrificing heatmap quality. A value of "1" creates the best heatmap visualisation. Default is "2", this creates high resolution heatmaps while preserving good performance | |||
|Pixels | |||
|- | |||
!Item | |||
!Description | |||
!Value type | |||
|- | |||
|HeatmapGroupSettings.KernelRadius | |||
|Controls the size of the heatmap measured from every data point | |||
|Value in Pixels or Meters, controlled by HeatmapGroupSettings.KernelRadiusUnit | |||
|- | |||
|HeatmapGroupSettings.KernelRadiusUnit | |||
|Controls the unit type for '''HeatmapGroupSettings.KernelRadius''' | |||
| "Pixels" or "Meters" | |||
|- | |||
|HeatmapGroupSettings.KernelShape | |||
|Controls how point values are distributed across the heatmap radius. See https://en.wikipedia.org/wiki/Kernel_(statistics)#Kernel_functions_in_common_use | |||
|"Quartic", "Triangular", "Uniform", "Triweight", Epanechnikov" or "Gaussian" | |||
|- | |||
|HeatmapGroupSettings.ValueScale | |||
|Can be used to compress or expand the values in the heatmap. Manipulating TimeScale can be used to compensate for accelerated log playback or to enhance visualisations of certain areas of interest without editing the color tables | |||
|double (Factor) | |||
|- | |||
|Heatmap.MaxPixelRadius | |||
|Limits the maximum number of pixels in the heatmap radius. When selecting RadiusType "Meters", setting this parameter will limit the maximum heatmap size when zooming in. This may prevent sluggish performance. | |||
|Pixels | |||
|- | |||
|} | |||
=== Heat map colors === | === Heat map colors === | ||
Revision as of 13:49, 17 November 2020
General
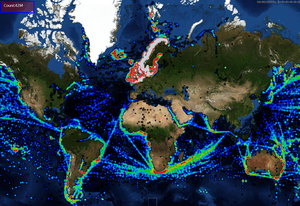
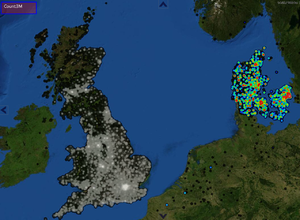
Heat maps are typically used to indicate density of data points geographically using color coding. They can be used to visualise large amounts of point data in 2D.
Examples include:
- Historical positions
- Population densities
- Frequency of events
https://en.wikipedia.org/wiki/Heat_map
Typically, bright of "hot" colors are used to indicate high level of activity or denser areas while "cooler" colors are used to indicate lower levels of activity. Several different palettes can be used for heatmaps. Some examples can be found here: https://www.andrewnoske.com/wiki/Code_-_heatmaps_and_color_gradients
Heat maps in GDK
Track history can be visualised as heatmaps directly: http://docs.maria.teleplanglobe.com/Track_history#Track_history_heatmap
In addition, heat maps are implemented as a separate layer in Maria GDK. IHeatMapLayerViewModel exposes the heat map API:
namespace TPG.GeoFramework.HeatMapLayer
{
    /// <summary>
    /// View model for general heat maps
    /// </summary>
    public interface IHeatMapLayerViewModel:IGeoLayerViewModel
    {
        /// <summary>
        /// Heat map data is organized in HeatMapGroups. Each group contains clusters of heat map data.
        /// Separate settings and color palettes can be set for each group.
        /// Note that the heat map property setters are applied to both default settings and to all groups.
        /// For detailed, individual group settings control, access elements in the HeatMapGroups directly
        /// </summary>
        ObservableCollection<HeatMapGroup> HeatMapGroups { get; }

        /// <summary>
        /// HeatMapSettings contain global settings and a default group setting that
        /// is used when no settings are available for a heat map group.
        /// </summary>
        HeatMapSettings HeatMapSettings { get; }

        /// <summary>
        /// Sets kernel radius unit (meters or pixels)
        /// </summary>
        KernelRadiusUnitEnum KernelRadiusUnit { get; set; }

        /// <summary>
        /// Kernel radius, unit controlled by KernelRadiusUnit
        /// </summary>
        UInt32 KernelRadius { get; set; }

        /// <summary>
        /// Sets kernel shape. The kernel shape controls how values are smoothed in the HeatMap.
        /// See https://en.wikipedia.org/wiki/Kernel_(statistics)#Kernel_functions_in_common_use
        /// </summary>
        KernelShapeEnum KernelShape { get; set; }

        /// <summary>
        /// Max pixel radius used when applying kernel. This is relevant when setting the kernel unit to "meters"
        /// and is used to limit demanding calculations
        /// </summary>
        double MaxPixelRadius { get; set; }

        /// <summary>
        /// Multiplier is applied to all values prior to applying the kernel
        /// </summary>
        double ValueScale { get; set; }

        /// <summary>
        /// Smaller grid cell sizes yield higher quality heat maps. Larger grid cell sizes are quicker. Typical range is 1-10.
        /// </summary>
        int GridCellSize { get; set; }
    }
}
Adding positions
Positions are addud using IHeatMapLayerViewModel.HeatMapGroups. The following sample contains code from NGTester used to load heat map data from file:
public static HeatMapGroup CreateTestGroup(string fileName)
{
    PositionGroupCollection testData;
    using (var stream = File.Open(fileName, FileMode.Open))
        testData = PositionGroupCollection.Parser.ParseFrom(stream);

    var result = new HeatMapGroup
    {
        Settings = new HeatMapGroupSettings {KernelShape = KernelShapeEnum.Triweight},
        Name = !string.IsNullOrWhiteSpace(testData.Name) ? testData.Name : NameFromFileName(fileName)
    };

    foreach (var item in testData.PositionGroups)
    {
        var hdi = new HeatMapItemData
        {
            Id = item.Name,
            GeoData = new HeatMapGeoData(item.Positions.Select(a => new GeoPos(a.Lat, a.Lon)).ToArray())
        };
        result.Add(hdi.Id, hdi);
    }
    return result;
}

heatMapVm.HeatMapGroups.Add(CreateTestGroup("some_test_data.geo");
Where PositionGroupCollection and "some_test_data.geo" is defined as a protobuf message:
message Position
{
	double lat=1;
	double lon=2;
}

message PositionGroup
{
	string Name=1;
	repeated Position Positions=2;
}
message PositionGroupCollection
{
	string Name=1;
	repeated PositionGroup PositionGroups=2;
}
Heat map settings
Heat map settings affects how the heat map is generated and displayed. IHeatMapLayerViewModel.HeatMapSettings control global settings and defaults. In addition, each HeatMapGroup contains an optional HeatMapGroupSettings
| HeatMapSettings.GridCellSize | Controls quality of grid display. Higher values will greatly boost performance, while sacrificing heatmap quality. A value of "1" creates the best heatmap visualisation. Default is "2", this creates high resolution heatmaps while preserving good performance | Pixels |
| Item | Description | Value type |
|---|---|---|
| HeatmapGroupSettings.KernelRadius | Controls the size of the heatmap measured from every data point | Value in Pixels or Meters, controlled by HeatmapGroupSettings.KernelRadiusUnit |
| HeatmapGroupSettings.KernelRadiusUnit | Controls the unit type for HeatmapGroupSettings.KernelRadius | "Pixels" or "Meters" |
| HeatmapGroupSettings.KernelShape | Controls how point values are distributed across the heatmap radius. See https://en.wikipedia.org/wiki/Kernel_(statistics)#Kernel_functions_in_common_use | "Quartic", "Triangular", "Uniform", "Triweight", Epanechnikov" or "Gaussian" |
| HeatmapGroupSettings.ValueScale | Can be used to compress or expand the values in the heatmap. Manipulating TimeScale can be used to compensate for accelerated log playback or to enhance visualisations of certain areas of interest without editing the color tables | double (Factor) |
| Heatmap.MaxPixelRadius | Limits the maximum number of pixels in the heatmap radius. When selecting RadiusType "Meters", setting this parameter will limit the maximum heatmap size when zooming in. This may prevent sluggish performance. | Pixels |
Heat map colors
Standard colors
Custom colors
Weighted positions
Multiple heat map groups
This category currently contains no pages or media.

