Development profiling: Difference between revisions
(→�) |
(→�) |
||
| Line 15: | Line 15: | ||
TPG.GeoFramework.NativeLayerBridge3D.Contracts.IMap3DInterfacer | TPG.GeoFramework.NativeLayerBridge3D.Contracts.IMap3DInterfacer | ||
for 3D displays. Both these interfaces has a boolean property called | for 3D displays. Both these interfaces has a boolean property called <pre>ShowPerformanceGraphs</pre> to enable/disable the graph. | ||
[[Category:Creating applications]] | [[Category:Creating applications]] | ||
Revision as of 16:22, 15 March 2021
Profiling frame rate
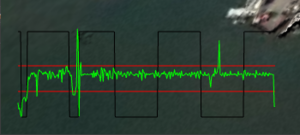
There is a built-in graph for visualizing the frame rate of the renderer which can be useful for debugging and profiling purposes.
The green graph shows frames per second over time. The two red horizontal lines are at 30 and 60 frames per second. The black line cycling up and down is simply a seconds counter. It switches up and down each second of rendering time which may or may not be the same as running time, dependent on how you hva set up the rendering loop. Normally you do not want any rendering unless something has changed in the map or 3D scene, and the rendering time will run only as long as something is actually drawn.
This graph can be enabled through the interface
TPG.GeoFramework.NativeLayerBridge.ContractsIMapInterfacer
for 2D map display, and
TPG.GeoFramework.NativeLayerBridge3D.Contracts.IMap3DInterfacer
for 3D displays. Both these interfaces has a boolean property called
ShowPerformanceGraphs
to enable/disable the graph.
