Importing data: Difference between revisions
(→�) |
(→�) |
||
| Line 150: | Line 150: | ||
[[File:M3_mapimport_routingDB.PNG]] | [[File:M3_mapimport_routingDB.PNG]] | ||
== 3D | == 3D Tiles == | ||
''From version 4.2'' | ''From version 4.2'' | ||
[[File:M3_import_3D_collection.PNG]] | [[File:M3_import_3D_collection.PNG]] | ||
M3 supports importing various 3D model formats. The models will be converted to | M3 supports importing various 3D model formats. The models will be converted to 3D Tiles. | ||
[[Category:Maria Map Maker]] | [[Category:Maria Map Maker]] | ||
Revision as of 14:36, 2 September 2021
To use georeferenced data in M3, it needs to be optimized and imported into a product in your workspace. There are several ways to start an import:
- Drag and drop any supported files or folders from Windows File Explorer onto the map area in M3. You can do this at any time regardless of where you are in your workflow. The only prerequisite is that you have an active workspace.
- When you have a basemap or overlay open, click Add Layer → Import from file/folder
- For elevation data, in addition to the two methods above, you can also use Add content → Elevation in an open product.
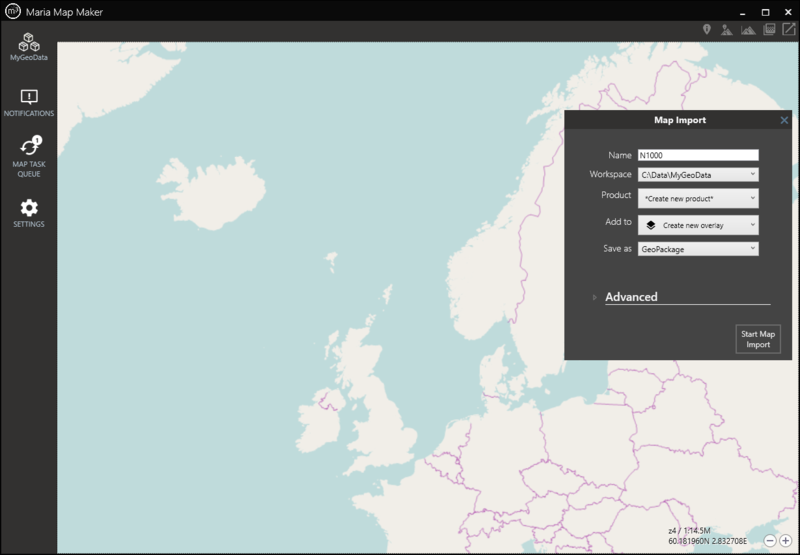
All of these will result in a Map Import window on the right side of the map area. This is where you set your options and start the import process. These options will differ depending on of both the source and destination data formats. There are a few common options, however.
Common options
| Name | Used to generate the map signature, which uniquely identifies this map when adding it to basemaps and overlays. It is also used as the product name, if you choose to import it into a new product. |
| Workspace | Lists all your active workspaces. Choose which of them to import the map to. |
| Product | Lists all the available (Draft) products in the chosen workspace. If you have a product, basemap or overlay open, this product will be the default choice. You can also choose to Create new product specifically for the map you are importing. |
| Add to | Automatically add the map as a layer to a new or existing overlay/basemap in the selected product. You can also choose to not add it as layer. |
| Save as | Lists the available destination formats for the source data you are importing. |
| Advanced | These options vary according to the input data and the chose destination format, and can often be left to their default values. See the pages for raster and vector imports for a description of these options. |
Map Tasks
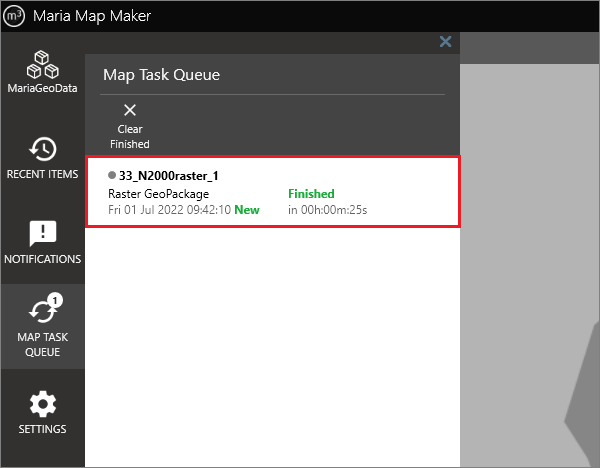
When you start the Map Import process, a Map Task will be created. You can monitor it in the Map Task Queue window. You can have several map tasks active at the same time.
From version 4.2:
Double-click a finished map task to open the product which it was imported to.
Placeholder layer
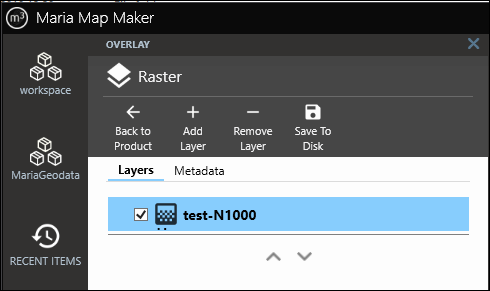
When you choose to add your vector or raster dataset as a layer in an overlay/basemap using the Add to option, a placeholder layer will be created there. The animated icon indicates that the dataset referenced by the layer is still processing. When the map task is finished, it will turn into a normal layer, and the dataset will be visible in the map. This happens automatically, regardless of what you are doing in the application.
Raster data
Importing raster data is usually quite simple. However, you have to make sure that if you're importing multiple files into a single dataset, they have to be homogenous (same file format, pixel size, projection, band types)
Depending on the source file format you can either choose to save as GeoPackage, or use the source format without translation. With some formats (ECW and MrSID), it's recommended to use the source format. These are formats which already have good performance, and translating them to GeoPackage leads to larger file size and loss of image quality.
Parameters
Different source formats will have different parameters.
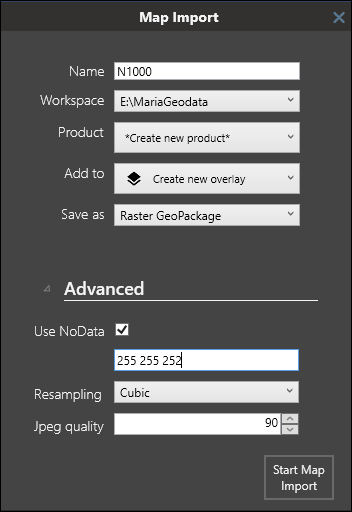
- Nodata - If the source data is an RGB raster, the nodata parameter should be a space-separated list of RGB values to make transparent - for example
0 0 0. If the source data uses a color palette, then the parameter is single number - the color index to make transparent. - Projection/Proj4 - These parameters only appear if projection information cannot be found in the source files. A few common projections are provided in the dropdown menu, or you can type in a projection in Proj4 format.
- Resampling - Resampling method to use when creating downsampled overviews.
- Jpeg quality - the level of compression to use when creating jpeg tiles. A larger number results in better quality and larger file size. 75-90 is usually a good balance between size and quality.
- Tile format - From version 4.2 - Image format for tiles in the output GeoPackage. "Auto" uses JPEG on opaque tiles and PNG on tiles where transparency is needed. "PNG" uses 32 bit RGBA PNG format on all tiles. "PNG8" calculates a color table with maximum 256 different colors for each tile. The "PNG8" option can reduce file size significantly when the input data has few unique colors.
Raster data with more than 8 bit
If a file has bands with more than 8 bit, it is usually elevation data. But in some cases, it can also be imagery from a satellite. Because Maria GDK and the GeoPackage format only supports 8 bit bands for maps and imagery, these datasets must be scaled down in the import process. In M3, this is handled as follows:
| Number of bands | Bits per band | Comment |
|---|---|---|
| 1 | > 8 | Use Save as GeoPackage (Scale to 8 bit). Values are automatically scaled using default parameters as described in the gdal_translate documentation |
| 3 | > 8 | Use Save as Raster GeoPackage. You can change the scale interval with the parameter Scale factor. This will affect the contrast of the resulting GeoPackge - a lower number results in a brighter image. |
Vector data
When Maria Map Maker imports vector data, it is translated to Vector Tiles. This is a very high-performant format, but the translation process requires some tuning and know-how to get the result you want.
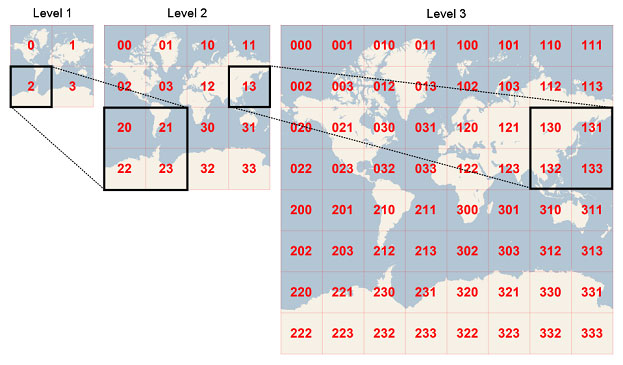
The Vector Tiles format splits the vector data into tiles, and puts each tile into a particular zoom level. Zoom level 0 is a single tile which covers the entire Earth (in Web Mercator projection). With every increasing zoom level, each tile is divided into four. As an example, zoom level 15 roughly equals map scale 1:15 000 at the equator. At this level the Earth is split into slightly more than a billion tiles.
When importing vector data to Vector Tiles, you need to decide which zoom levels (z) to create. This zoom extent is not possible to change later. The vector data simply does not exist on the levels outside the zoom extent you choose. This means that you have to be familiar with your source data and how they are going to be used. Using zoom levels which are not appropriate for the source data can have some negative effects:
- Using too low zoom level - too much data is stored in each tile, which leads to poor performance.
- Using too high zoom level - large, simple features are split across an exaggerated number of small tiles, which leads to unnecessary large files and long processing time.
An example could be some very detailed building data for a city. If you try to import these into z10-z12, all the data will probably be pushed into a single, huge tile at z10. This would cause very poor performance in the finished map.
Overzoom
The overzoom function eases the zoom extent choice somewhat. It lets you display vector features at higher zoom levels than what they were created for. If you for example create a dataset at z10-z14, the default use of overzoom in M3 (6 levels) lets the data be visible all the way down to z20.
The downside with using overzoom is that performance will decrease as overzoom increases. The precision of the vertices of the vector data also decreases.
Starting import
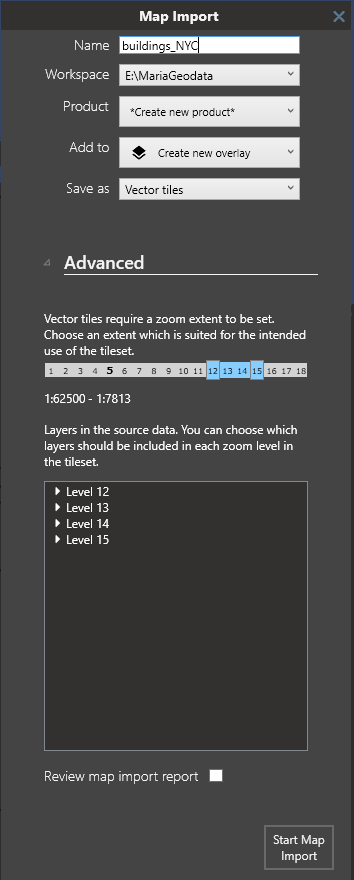
Choose the zoom extent with the two sliders. The zoom indicator shows the current zoom level in the map. Below, all the zoom levels in the zoom extent are listed. They can each be expanded, and you can uncheck layers that you don't need at that particular zoom level. By selecting Review map import report you can get an analysis of the file you created. Each zoom level will have a list of "concerns", indicating if there is too much data on that level. When you are satisfied with your settings, start the map import.
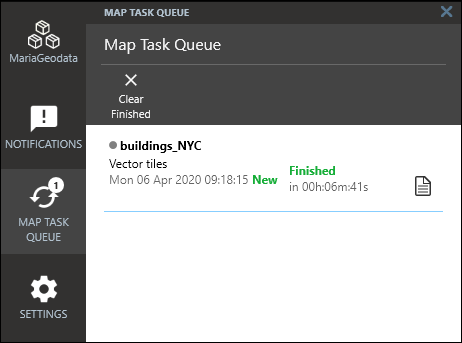
A map task will start, and you can monitor its progress in the Map Task Queue. If you selected Review map import report, you can click the "Report" icon.
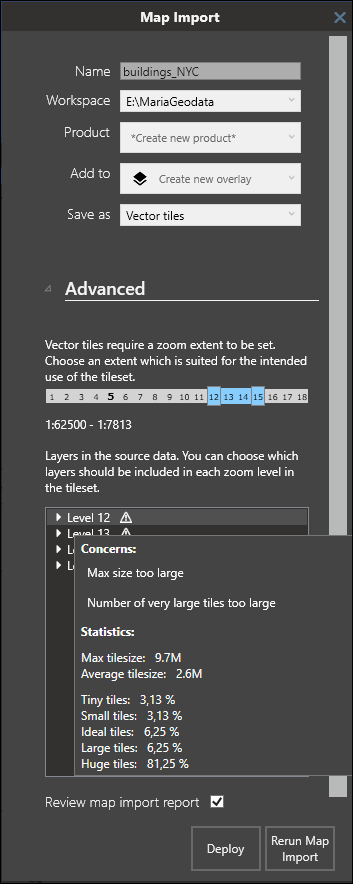
This will open the Map Import window again, but now an analysis has been performed on the vector tiles. You get the opportunity to re-run the translation process with different settings according to the analysis.
Mouse over each layer to read the result. Zoom levels with a ! have been determined to be sub-optimal. The messages from these will inform you of one of the following:
- Max size too large and Fraction/number of large tiles too high - You have put data which is too detailed into a zoom level which is too low. Each tile should ideally not be more than 0.1 MB. Depending on the size of the dataset, however, having a few tiles a little over 0.1 MB is not necessarily a problem. When many of them exceed 0.2 MB however, you should consider re-running the process with a higher minimum zoom level.
- Tiles contain little data - this is not as much of a problem as the opposite. The size of the data file will be larger than it could be, but performance will not be affected.
If you change any settings according to the analysis, you have to use Rerun Map Import, and the translation process will start over. If you use Deploy the map import will be finalized to your workspace as it is.
Elevation data
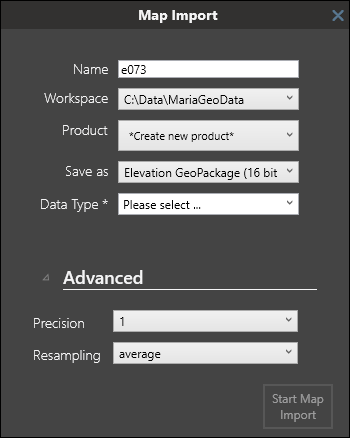
Importing elevation data with M3 results in a tiled gridded coverage GeoPackage. Before starting the import, you have to specify the type of elevation data being imported in the Data Type menu:
- Terrain Model - Models the ground terrain, where trees and man-made structures have been removed.
- Surface Model - Models the surface of the earth, where trees and man-made structures are present.
- Bathymetry - Models the sea bed
There are two choices in the Save as dropdown:
Elevation GeoPackage (16 bit)
The elevation data is stored in PNG tiles with 16 bit integer pixels. This option is the most space efficient, and usually sufficient for elevation data with 10 meter resolution or lower. The Precision parameter lets you choose how many decimal places to use in each sample. The default (0.1) means that each cell is rounded to the nearest decimeter.
The ResamplingMethod parameter controls the resampling method to use when creating overviews.
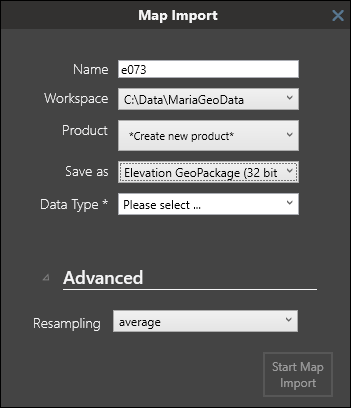
Elevation GeoPackage (32 bit)
The elevation data is stored in TIFF tiles with 32 bit float pixels. This option will retain the precision of the source data at the cost of larger file size.
The ResamplingMethod parameter controls the resampling method to use when creating overviews.
Location data
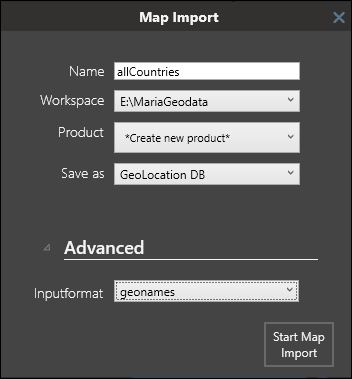
M3 can create geolocation databases from text files. The text files must be formatted according to one of several well established schemas/sources:
- GNS - NGA GEOnet Names Server - Non-US placenames
- GNS_US - US placenames
- Geonames - Global placenames
Routing databases
From version 4.1
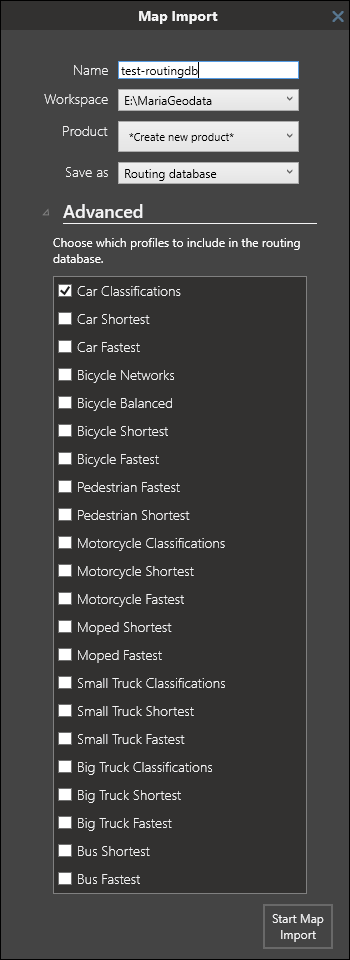
M3 can create routing databases based on Openstreetmap raw data (pbf files). These files can be exported from the map at openstreetmap.org, or they can be downloaded from services such as Geofabrik. The routing databases can be used by a Maria GDK-based application to calculate the fastest route between two points.
Profiles
When importing the data, you can select which profiles to include in the output database. A profile describes a vehicle and its behaviour when travelling the road network. Note that the profiles cannot be changed after the database has been created. Hover the mouse over each profile for a short description.
3D Tiles
From version 4.2
File:M3 import 3D collection.PNG
M3 supports importing various 3D model formats. The models will be converted to 3D Tiles.
