Mapbox vector datasets
From version 4.3
Maria Map Maker supports the Mapbox vector tiles format, as well as a subset of the Mapbox JSON style specification. This article explains the process of importing and styling vector data with these formats.
Import
Format
When Maria Map Maker imports vector data, it is translated to Mapbox vector tiles (.mbtiles). This is a very high-performant format, but the translation process requires some tuning and know-how to get the desired result.
The MBTiles format splits the vector data into tiles and zoom levels. Each tile contains 4096 x 4096 nodes, which are roughly equivalent to a pixel in a raster image. When vector data is converted to MBTiles, all vertices are snapped to the nearest node in a tile, losing some precision in the process.
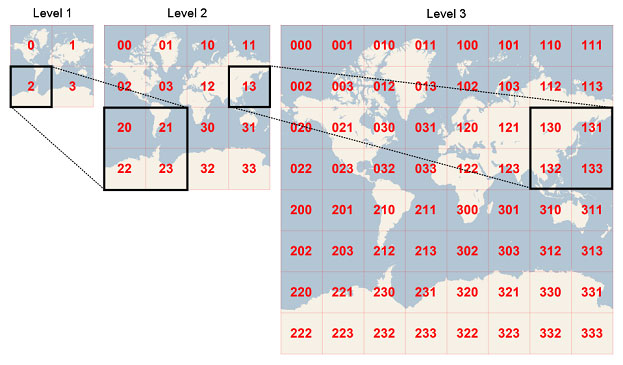
Each tile belongs to a zoom level. Zoom level 0 is a single tile which covers the entire Earth (in Web Mercator projection). With every increasing zoom level, each tile is divided into four. As an example, zoom level 15 roughly equals map scale 1:15 000 at the equator. At this level, the entire Earth consists of around one billion tiles.
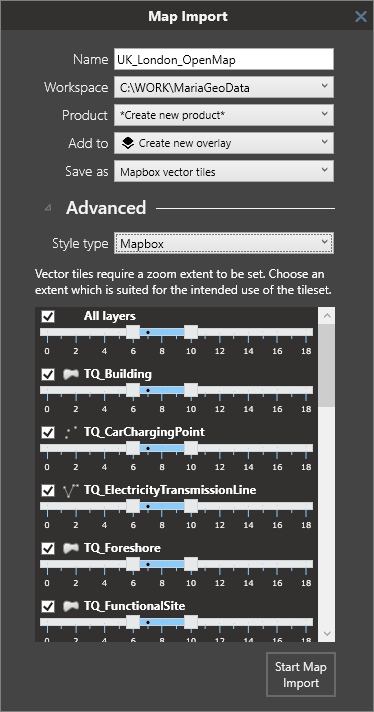
When importing vector data to MBTiles, you need to decide which zoom levels (z) to create. This zoom extent is not possible to change later. The vector data simply does not exist on the levels outside the zoom extent you choose. This means that you have to be familiar with your source data and how they are going to be used. Using zoom levels which are not appropriate for the source data can have some negative effects:
Using too low zoom level - too much data is stored in each tile, which would lead to poor performance. To prevent this, after a tile reaches a threshold of 500 KB or 200 000 features, additional features destined for that tile will either be simplified or dropped. Using too high zoom level - large, simple features are split across an exaggerated number of small tiles, which leads to unnecessary large files and long processing time.
Import dialog
The vector data import dialog lists all the layers in the source dataset, with a zoom selector for each. The checkboxes controls wether or not the layer is included in the resulting MBTiles dataset. You can use the top "All layers" control to set a common data range.
You can choose the style format for the output dataset - the Mapbox JSON format described in this article, or the legacy MARIA GDK XML format. The MARIA GDK style will be phased out starting with MARIA GDK version 4.3.
Style layers
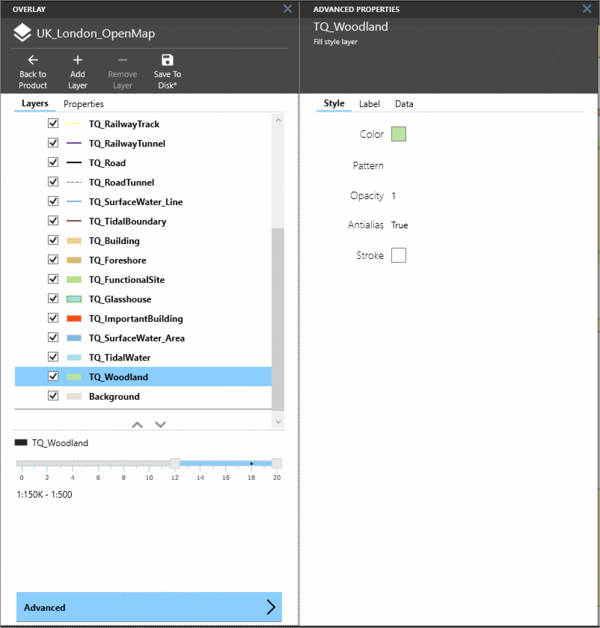
Style layers are listed by expanding the dataset in a basemap/overlay. The list has several functions:
- Drag-drop layers to change the drawing order (the top layer in the list will be drawn on top in the map).
- Show or hide layers with the checkbox.
- Single-click a layer twice (slow double-click) to change its name
Create new layer
To create a new layer, simply right-click anywhere in the Style layers list, and then select the layer type from the New layer submenu. A new layer will be created at that position. Finally, go to the Data tab to select a Source layer.
Style tab
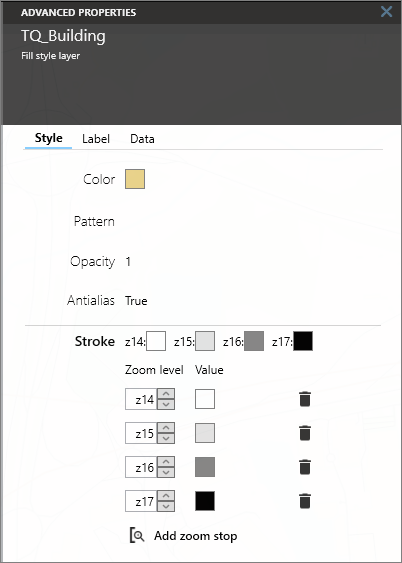
Styles are configured by double-clicking a layer and selecting the "Style" tab. Style properties are documented by mousing over the property name. The style properties vary by the type of layer:
Fill
A fill style layer renders one or more filled (and optionally stroked) polygons on a map.
Line
A line style layer renders one or more stroked polylines on the map.
Symbol
A symbol style layer renders icon and text labels at points or along lines on a map.
Background
A layer which covers the entire dataset. Useful if your content does not cover everything and you want to configure a background color.
Label
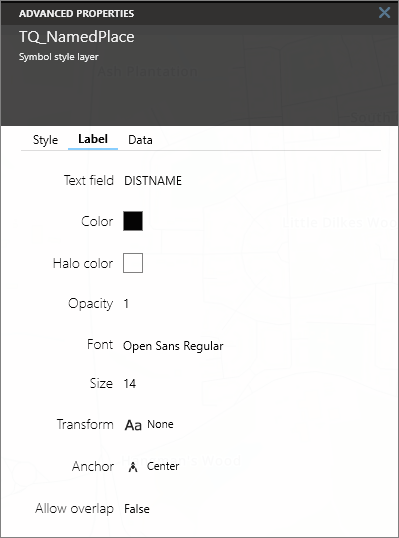
A text label can be configured on any type of layer. Click the "Label" tab and select an attribute for the "Text field" property to activate the label. You can then configure the appearance of the label with various properties.
Data
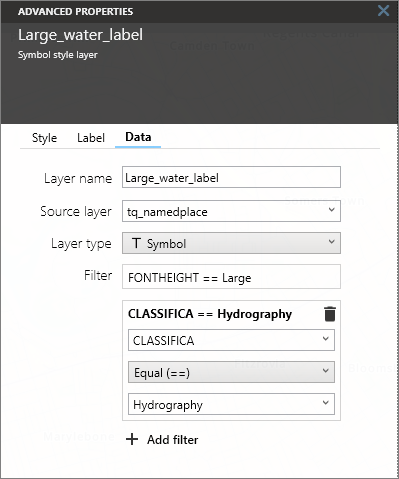
The Data tab contains settings related to the data source of the style layer.
Source layer
Source layers are the named layers in the MBTiles data file. A style layer must always reference a source layer (except for the background layer). The source layer type is indicated with an icon in the list (either Line, Fill, or Symbol).
Layer type
Layer type for this Style layer. This does not have to match the type of source layer it is referencing. By using a different type, you get some additional style options:
| Source layer type | Style layer type | Result |
|---|---|---|
| Polygon | Line | Outline of polygons are drawn |
| Polygon | Symbol | Text labels or icons are drawn within the polygon |
| Line | Symbol | Text labels or icons are drawn along the line |
Filters
A filter is a requirement that a feature must meet to be drawn in the map. When you create a new filter, you must select an attribute, an operator and a value. The value menu contains a small sample of values from the selected attribute, but you can also type in any value. Only features which match the filter will be drawn. You can create multiple filters on a layer, which all have to match for a feature to be drawn.
Zoom selector
Each style layer's visibility can be controlled with the zoom selector at the bottom of the Layers window. The Zoom selector consists of two sliders which represent the max and minimum zoom levels where the layer is visible. If the map is zoomed outside the area between the sliders, the layer will be hidden. The zoom selector is automatically adjusted so that its not possible to set a minzoom where the source layer does not exist. This is represented as a scribbled area. The "Valid" area is the interval between minzoom and (maxzoom + overzoom).
Advanced styling
These are some tips for more advanced users.
Grouping
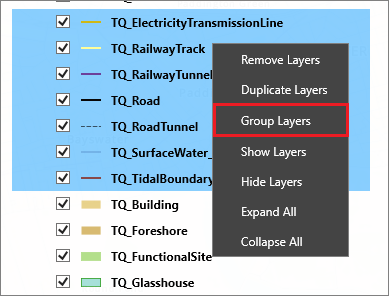
Layers can be grouped together by selecting multiple layers with Ctrl+left click. Right-click the selection, and click "Group layers". This allows the layers to be moved and and turned on and off as a single unit.
Duplicate layer
Any layer can be duplicated, where the only difference from the original is the name. This is useful if you for example want to style a line with an inner color and a different outline color. You would then place the duplicate below the original in the layer list, and set a slightly higher width.
Fanout
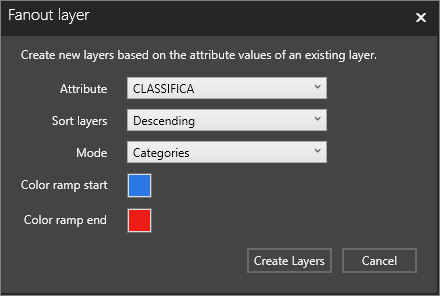
M3 can automatically set up a group of layers based on the attribute values in a layer. Right click any layer and click "Fanout" to open this dialog. There are two modes when using fanout: Category: A new layer is created for each unique value in the selected attribute. Both string and numerical attributes are supported. Graduated: The full range of values in the selected attribute are split into equally sized classes. The number of classes is can be controlled in the dialog. A new layer is created for each of these classes. Only numerical attributes are supported.
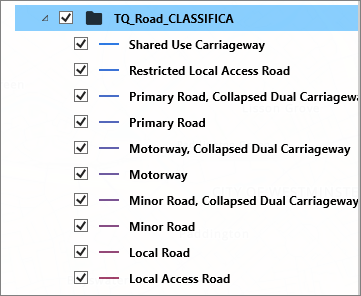
The fanout creates a number of new layers which are grouped together.
Style across zoom ranges
Many style properties have the ability to change according to the current map zoom level. For instance, this allows a smooth transition of line width or color as you zoom in and out.
Click "Style across zoom range" to activate the feature. You can then set up a list of zoom stops with corresponding value for the property. "Rate of change" controls the exponential change between stops. The default is 1.0, which increases values linearly. To disable this function, delete all zoom stops.
