Track history: Difference between revisions
Jump to navigation
Jump to search
(→�) |
No edit summary |
||
| Line 61: | Line 61: | ||
| DashStyle | | DashStyle | ||
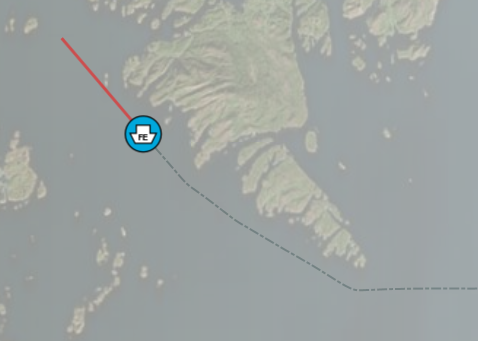
| Used to set history line dash. It consists of a comma separated list decimal numbers, the first specifies length of dash in pixels, the second the length of the spacing between dashes, the third the next dash length and so on. The history visualisation below was created using <source lang="XML"><valueitem name="DashStyle" value="4,2,1,2" /></source> | | Used to set history line dash. It consists of a comma separated list decimal numbers, the first specifies length of dash in pixels, the second the length of the spacing between dashes, the third the next dash length and so on. The history visualisation below was created using <source lang="XML"><valueitem name="DashStyle" value="4,2,1,2" /></source> | ||
|} | | | ||
|- | |||
| DrawClusterGrid | |||
| If 'true', | |||
|-} | |||
[[File:trackhistorydashstyle.png|none]] | [[File:trackhistorydashstyle.png|none]] | ||
---- | ---- | ||
[[Category:Tracks]] | [[Category:Tracks]] | ||
Revision as of 13:11, 26 August 2020
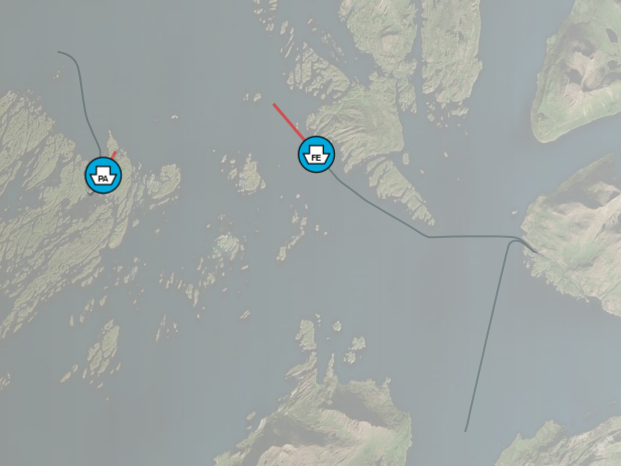
Track history visualisation controls how previous positions are displayed in the map. History styling includes amount of history to include as well as regular appearance styling. Track history belongs to the "TrackSymbol" style category.
<stylecategory "TrackSymbol">
  ...
  <compositeitem "History">
    ...
  </compositeitem>
</stylecategory>

Limits
Limits the amount of history data fetched from the service and how much history is displayed in the map. If more than one limit item is set, the most limiting value is applied.
<compositeitem name="History">
  <compositeitem name="Limits">
    <valueitem name="MaxLength" value="<percentage of screen diagonal>"/>
    <valueitem name="MaxAge" value="<seconds>"/>
    <valueitem name="MaxCount" value="<history points>"/>
  </compositeitem>
  ...
</compositeitem>
| Item | Description |
|---|---|
| MaxLength | Max length of history measured as percentage of screen diagonal. Note that this is an approximate measure and depends on active scale and projection. |
| MaxAge | Max age in seconds. Any history points older than this value will be discarded/filtered out |
| MaxCount | Max count of history points |
Visual
History visual settings control graphical appearance of the track history.
<compositeitem name="Visual">
  <valueitem name="DrawLines" value="<true|false>"/>
  <valueitem name="Color" value="<color>"/>
  <valueitem name="LineThickness" value="<pixels>"/>
  <valueitem name="DashStyle" value="<dashes specification>"/>
</compositeitem>

| Item | Description | |
|---|---|---|
| DrawLines | If false, no line is drawn. Future extensions may include display of individual history points, for now history is invisible if this is set to false | |
| Color | Color of history line | |
| LineThickness | Thickness of history line in pixels | |
| DashStyle | Used to set history line dash. It consists of a comma separated list decimal numbers, the first specifies length of dash in pixels, the second the length of the spacing between dashes, the third the next dash length and so on. The history visualisation below was created using <valueitem name="DashStyle" value="4,2,1,2" />
|
|
| DrawClusterGrid | If 'true', |