Track history
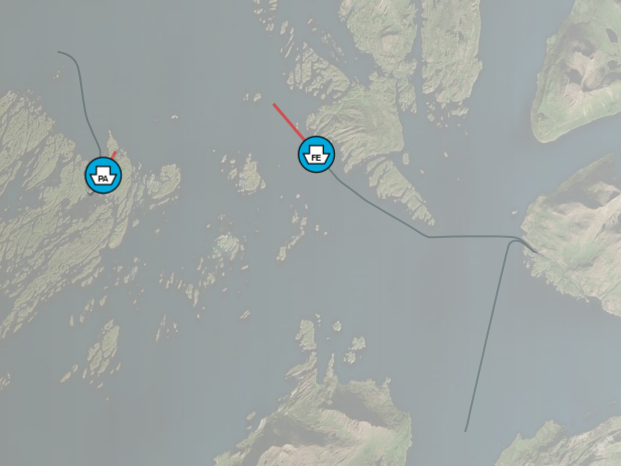
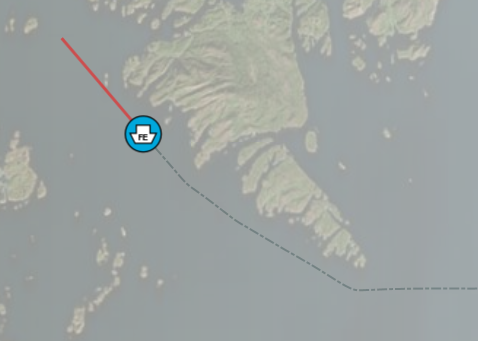
Track history visualisation controls how previous positions are displayed in the map. History styling includes amount of history to include as well as regular appearance styling. Track history belongs to the "TrackSymbol" style category.
<stylecategory "TrackSymbol">
  ...
  <compositeitem "History">
    ...
  </compositeitem>
</stylecategory>
Limits
Limits the amount of history data fetched from the service and how much history is displayed in the map. If more than one limit item is set, the most limiting value is applied.
<compositeitem name="History">
  <compositeitem name="Limits">
    <valueitem name="MaxLength" value="<percentage of screen diagonal>"/>
    <valueitem name="MaxAge" value="<seconds>"/>
    <valueitem name="MaxCount" value="<history points>"/>
  </compositeitem>
  ...
</compositeitem>
| Item | Description |
|---|---|
| MaxLength | Max length of history measured as percentage of screen diagonal. Note that this is an approximate measure and depends on active scale and projection. |
| MaxAge | Max age in seconds. Any history points older than this value will be discarded/filtered out |
| MaxCount | Max count of history points |
Visual
History visual settings control graphical appearance of the track history.
        <compositeitem name="Visual">
          <valueitem name="DrawVectorCluster" value="false"/>
          <valueitem name="DrawGridCluster" value="true"/>
          <valueitem name="DrawLines" value="false"/>
          <valueitem name="Color" value="0,32,32,196"/>
          <valueitem name="FadedColor" value="0,32,32,32"/>
          <valueitem name="FadeTime" value="10"/>
          <valueitem name="LineThickness" value="3.0"/>
        </compositeitem>
| Item | Description |
|---|---|
| DrawLines | If true, line with specified color, thickness and dash style is drawn between track history points |
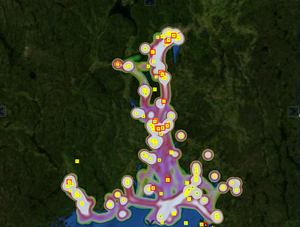
| DrawGridCluster | If true, display gridded cluster data/heatmap representing the time spent in an area. Each grid cell accumulates "loiter time" for all tracks, grid properties are controlled using the history substyle named "Clustering" See below for details on clustering and heatmaps |
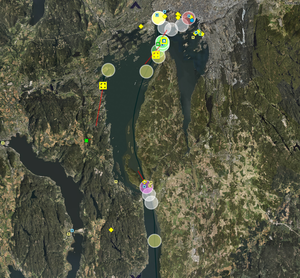
| DrawVectorCluster | If true, display circles representing the time spent in an area. Vector clusters are analysed individually for each track See below for details on clustering and heatmaps |
| Color | Color of history line |
| LineThickness | Thickness of history line in pixels |
| DashStyle | Used to set history line dash. It consists of a comma separated list decimal numbers, the first specifies length of dash in pixels, the second the length of the spacing between dashes, the third the next dash length and so on. The history visualisation below was created using <valueitem name="DashStyle" value="4,2,1,2" />
|
Track history heatmap
Heatmaps can be used to visualise the level of activity. "Hot" colors indicate high level of activity while no coloring or cooler colors indicate less activity. General information about heatmaps can be found here: https://en.wikipedia.org/wiki/Heat_map
Visualisation is controlled using standard GDK track styling.
<compositeitem name="History">
  ...
  <compositeitem name="Visual">
    <valueitem name="DrawHeatMap" value="true"/>
    ...
<compositeitem name="HeatMap">
  <valueitem name="Radius" value="[heatmap.radius]"/>
  <valueitem name="RadiusType" value="[heatmap.radiustype]"/>
  <!--RadiusType: Meters, Pixels-->
  <valueitem name="KernelShape" value="[heatmap.kernel]"/>
  <!--KernelShape: Quartic, Triangular, Uniform, Triweight, Epanechnikov or Gaussian-->
  <valueitem name="MaxPixelRadius" value="[heatmap.maxpixelradius]"/>
  <valueitem name="TimeScale" value="[heatmap.timescale]"/>
  <valueitem name="GridCellSize" value="[heatmap.gridcellsize]"/>

  <compositeitem name="ColorCategories">
    <valueitem name="Bounds" value="1,20,120,300,600,1800,3600,7200"/>
    <valueitem name="Colors" value="#20000000,#80000000,#8040ff40,#80c7b22e,#80ffff80,#80ff80ff,#80ff4040,#a0ffffff"/>
  </compositeitem>
</compositeitem>
Style parameters
All heatmap parameters are located in "TrackSymbol/History".
| Item | Description | Value type |
|---|---|---|
| Visual.DrawHeatmap | Controls heatmap visibility. In order to display track history heatmap, tracks and track history must be loaded, track style must contain a valid "History/HeatMap" section and this parameter must be set to true | boolean |
| Heatmap.Radius | Controls the size of the heatmap measured from every history point | Value in Pixels or Meters, controlled by Heatmap.RadiusType |
| Heatmap.RadiusType | Controls the unit type for Heatmap.Radius | "Pixels" or "Meters" |
| Heatmap.KernelType | Controls how point values are distributed across the heatmap radius. See https://www.geodose.com/2017/11/qgis-heatmap-using-kernel-density.html | "Quartic", "Triangular", "Uniform", "Triweight", Epanechnikov" or "Gaussian" |
| Heatmap.TimeScale | Can be used to compress or expand the values in the heatmap. Manipulating TimeScale can be used to compensate for accelerated log playback or to enhance visualisations of certain areas of interest without editing the color tables | Factor |
| Heatmap.GridCellSize | Controls quality of grid display. Higher values will greatly boost performance, while sacrificing heatmap quality. A value of "1" creates the best heatmap visualisation. Default is "2", this creates high resolution heatmaps while preserving good performance | Pixels |
| Heatmap.MaxPixelRadius | Limits the maximum number of pixels in the heatmap radius. When selecting RadiusType "Meters", setting this parameter will limit the maximum heatmap size when zooming in. This may prevent sluggish performance. | Pixels |
ColorCategories
Color categories are used to control heatmap coloring and when to change colors. "Bounds" determine when to apply a given color. The bounds parameter is "accumulated seconds of loiter". This is a somewhat diffuse concept due to heatmap accumulation and history point time estimation which depend on several parameters like kernel type, cell size, radius, time scale and to some extent grid cell size. A higher value will indicate longer accumulated loiter. Bounds is a comma separated list of increasing values (pseudo seconds). Colors is a list of colors, one for each "Bounds"-element. The format is #aarrggbb where each aa, rr, gg, bb is a hex value from 00 to ff. Note that colors are smoothed.
Stationary history markers
Stationary markers are used to visualise activity and time spent in a region. Coloring is used to indicate loiter time in a specific region. Loiter time is used in this description to indicate the time spent within a area. Note that if an item moves slowly, long loiter times may result even if the number of observed history points is relatively low.
    <compositeitem name="History">
        <compositeitem name="Limits">
          ...
        </compositeitem>
        <compositeitem name="Visual">
          <valueitem name="DrawStationaryMarkers" value="true"/>
            ...
        </compositeitem>
        <compositeitem name="StationaryMarkers">
          <valueitem name="AnalysisCount" value="100"/>
          <valueitem name="ClusterRadius" value="500"/>
          <valueitem name="TimeScale" value="20"/>

          <compositeitem name="Category1">
            <valueitem name="MinSeconds" value="6"/>
            <valueitem name="LineColor" value="255,255,255,128"/>
            <valueitem name="FillColor" value="255,255,255,[heatmap.vector.alpha]"/>
          </compositeitem>
          <compositeitem name="Category2">
            <valueitem name="MinSeconds" value="15"/>
            <valueitem name="LineColor" value="255,255,255,128"/>
            <valueitem name="FillColor" value="128,255,128,[heatmap.vector.alpha]"/>
          </compositeitem>
        </compositeitem>
      </compositeitem>
General parameters:
| Item | Description | Unit | |
|---|---|---|---|
| AnalysisCount | Number of history points examined to determine contributions to local maxima. Lower values (<100) increase performance. Higher numbers (>100) decrease performance, used to visualise repeated visits to same region, for instance multiple stops at same harbour | Count | Vector |
| ClusterRadius | Controls cluster analysis. Same size is used for all clusters | Meters | |
| TimeScale | Loiter times are multiplied with this value for analysis and display purposes. Typically used during test, development or demontrations when analysing accelerated track logs. Set to 1 for production system | Factor |
Stationary marker categories
Markers are created by analysing history points for each track and checking how many neightbouring history points are within cluster range. Loiter time within cluster is accumulated, local maxima is selected by checking all points close to the initial point. Vector clusters aggregates isolated loiter for each track. Note that clusters may overlap
Vector cluster styling is controlled using one or more numbered categories named Category<n> where n >=1.
<compositeitem name="Category1">
  <valueitem name="MinSeconds" value="6"/>
  <valueitem name="LineColor" value="255,255,255,128"/>
  <valueitem name="FillColor" value="255,255,255,196"/>
</compositeitem>
<compositeitem name="Category2">
  <valueitem name="MinSeconds" value="15"/>
  <valueitem name="LineColor" value="255,255,255,128"/>
  <valueitem name="FillColor" value="128,255,128,196"/>
</compositeitem>
| Item | Description | Unit |
|---|---|---|
| MinSeconds | For a given loiter time, the vector cluster with largest n and MinSeconds<=loiter time is used to control visual appearance | Seconds |
| FillColor | Base color and transparency for cell. Uses standard style coloring, value="r,g,b,a" or value="#aarrggbb" (hex) | Color |
| LineColor | Outline color for vector cluster | Color |


