Color map layers: Difference between revisions
No edit summary |
No edit summary |
||
| (18 intermediate revisions by 2 users not shown) | |||
| Line 1: | Line 1: | ||
[[File:Colormap black 48px.png]] | [[File:Colormap black 48px.png]] | ||
Color map layers are | ''From version 4.4'' | ||
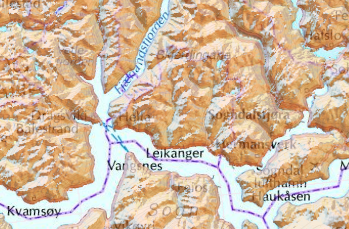
Color map layers are defined in overlay/basemaps, and visualize [[Importing_data#Elevation/Coverage_data|coverage datasets]] such as elevation, census, land cover, etc. The values in the datasets are matched with colors in a palette in the color map layer. Colors may be mapped directly to data values, or there may be a calculation involved. It is for example possible to assign colors based on slope (gradient) or aspect (direction of slope) of elevation datasets. | |||
In a basemap/overlay, these layers can be added by clicking '''Add Layer → Color map layer.''' | |||
<gallery widths="349" heights="229"> | <gallery widths="349" heights="229"> | ||
| Line 8: | Line 12: | ||
File:Aspect colormap.png|Aspect values | File:Aspect colormap.png|Aspect values | ||
</gallery> | </gallery> | ||
== | ==Palette== | ||
Color palettes are defined on the '''Palette''' tab, where either a new palette can be created or an existing palette edited. For | Color palettes are defined on the '''Palette''' tab, where either a new palette can be created or an existing palette edited. For each entry in the palette, you can edit '''Value''', '''Color''' and '''Start range.''' You can delete an entry by clicking the '''Trashcan''' button, or insert an entry at any point by mousing over the palette and using the '''insert indicator.''' | ||
'''Start range''' can be used to indicate that an entry should define the start of a range.This means that there will be no color interpolation to the previous entry. If there are no previous entry, then any pixel with a lower value will be transparent. | |||
[[File:M3_color_palette.png|border]] | [[File:M3_color_palette.png|border]] | ||
=== Create new palette === | === Create new palette === | ||
To create a new palette, click the '''Create new palette''' button. This will open a new dialog with several | To create a new palette, click the '''Create new palette''' button. This will open a new dialog with several options. | ||
==== Palette ==== | ==== Palette ==== | ||
The type of palette to create: | The type of palette to create: | ||
* Custom, a user defined palette for color map | * Custom, a user defined palette for color map. | ||
* Elevation, a predefined palette for elevation color map. | * Elevation, a predefined palette for elevation color map. | ||
* Bathymetry, a predefined palette for bathymetry color | * Bathymetry, a predefined palette for bathymetry color map. | ||
* Slope, a predefined palette for slope color map. | * Slope, a predefined palette for slope color map. | ||
* Aspect, a predefined palette for aspect color map. | * Aspect, a predefined palette for aspect color map. | ||
[[File:M3 create | [[File:M3 create palette.png|border]] | ||
When a custom palette is selected, several options are available. | |||
==== Analysis mode ==== | |||
The function used to calculate the color of each pixel. | |||
* ''Elevation'' where each pixel is colored according to its elevation value. | |||
* ''Slope'' where each pixel is colored according to its gradient or slope value. | |||
* ''Aspect'' where each pixel is colored according to the direction of slope. | |||
* ''Value'' where each pixel is colored according to its elevation value (same as ''Elevation''). | |||
==== | ===== Unit ===== | ||
The | The unit of the data which is being visualized. This is only used for display in a legend. | ||
==== Min value ==== | ==== Min value ==== | ||
| Line 40: | Line 53: | ||
==== Entries ==== | ==== Entries ==== | ||
The number of | The number of entries in the palette. | ||
===== Display precision ===== | |||
The number of decimals to use in the '''Value''' and '''Legend''' fields in the palette | |||
==== Color ramp start ==== | ==== Color ramp start ==== | ||
The start color of the color ramp. | The start color of the color ramp. This color is mapped to the ''Min value.'' | ||
==== Color ramp end ==== | ==== Color ramp end ==== | ||
The end color of the color ramp. | The end color of the color ramp. This color is mapped to the ''Max value.'' | ||
== Data | == Data source== | ||
Data sources are defined on the '''Data source''' tab. A data source is either elevation data or generic data (for example | Data sources are defined on the '''Data source''' tab. A data source is either elevation data or generic data (for example land cover, census, etc.) and can be selected from '''Type'''. The data source can be configured to use all available data sets, specific data sets or data sets based on tags. | ||
=== Data source from all datasets === | === Data source from all datasets === | ||
| Line 65: | Line 81: | ||
[[File:M3 colormap datasource tags.png|border]] | [[File:M3 colormap datasource tags.png|border]] | ||
[[Category:Maria Map Maker|580]] | [[Category:Maria Map Maker|580]] | ||
Latest revision as of 13:15, 26 September 2023
![]()
From version 4.4
Color map layers are defined in overlay/basemaps, and visualize coverage datasets such as elevation, census, land cover, etc. The values in the datasets are matched with colors in a palette in the color map layer. Colors may be mapped directly to data values, or there may be a calculation involved. It is for example possible to assign colors based on slope (gradient) or aspect (direction of slope) of elevation datasets.
In a basemap/overlay, these layers can be added by clicking Add Layer → Color map layer.
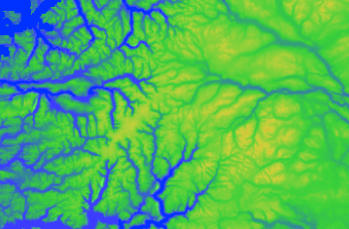
Elevation values
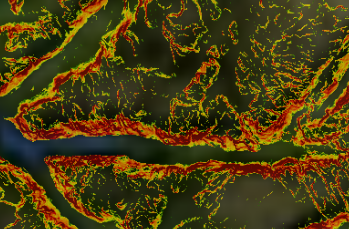
Slope values
Aspect values


Palette
Color palettes are defined on the Palette tab, where either a new palette can be created or an existing palette edited. For each entry in the palette, you can edit Value, Color and Start range. You can delete an entry by clicking the Trashcan button, or insert an entry at any point by mousing over the palette and using the insert indicator.
Start range can be used to indicate that an entry should define the start of a range.This means that there will be no color interpolation to the previous entry. If there are no previous entry, then any pixel with a lower value will be transparent.

Create new palette
To create a new palette, click the Create new palette button. This will open a new dialog with several options.
Palette
The type of palette to create:
- Custom, a user defined palette for color map.
- Elevation, a predefined palette for elevation color map.
- Bathymetry, a predefined palette for bathymetry color map.
- Slope, a predefined palette for slope color map.
- Aspect, a predefined palette for aspect color map.

When a custom palette is selected, several options are available.
Analysis mode
The function used to calculate the color of each pixel.
- Elevation where each pixel is colored according to its elevation value.
- Slope where each pixel is colored according to its gradient or slope value.
- Aspect where each pixel is colored according to the direction of slope.
- Value where each pixel is colored according to its elevation value (same as Elevation).
Unit
The unit of the data which is being visualized. This is only used for display in a legend.
Min value
The minimum value of the color range.
Max value
The maximum value of the color range.
Entries
The number of entries in the palette.
Display precision
The number of decimals to use in the Value and Legend fields in the palette
Color ramp start
The start color of the color ramp. This color is mapped to the Min value.
Color ramp end
The end color of the color ramp. This color is mapped to the Max value.
Data source
Data sources are defined on the Data source tab. A data source is either elevation data or generic data (for example land cover, census, etc.) and can be selected from Type. The data source can be configured to use all available data sets, specific data sets or data sets based on tags.
Data source from all datasets
To use all available datasets as data source select All datasets from Source.

Data source from specific datasets
To use specific datasets as data source select Specific datasets from Source and then select the datasets to include from the list of available datasets.

Data source from tags
To use tagged datasets as data source select Tags from Source and then add the tags of the datasets to include.
