MARIA GDK vector datasets
This article is valid for version 4.2 and older. For version 4.3, see Mapbox vector datasets
When Maria Map Maker imports vector data, it is translated to Vector Tiles. This is a very high-performant format, but the translation process requires some tuning and know-how to get the result you want.
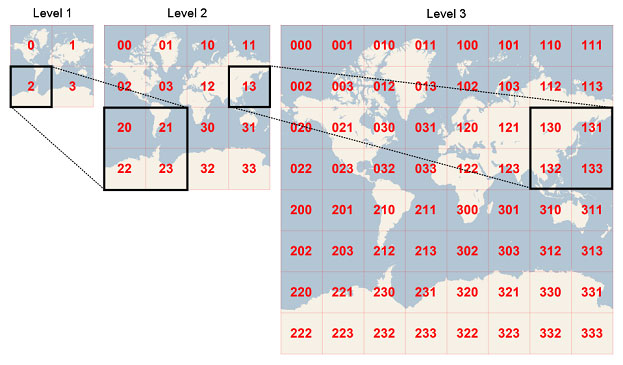
The Vector Tiles format splits the vector data into tiles, and puts each tile into a particular zoom level. Zoom level 0 is a single tile which covers the entire Earth (in Web Mercator projection). With every increasing zoom level, each tile is divided into four. As an example, zoom level 15 roughly equals map scale 1:15 000 at the equator. At this level the Earth is split into slightly more than a billion tiles.
When importing vector data to Vector Tiles, you need to decide which zoom levels (z) to create. This zoom extent is not possible to change later. The vector data simply does not exist on the levels outside the zoom extent you choose. This means that you have to be familiar with your source data and how they are going to be used. Using zoom levels which are not appropriate for the source data can have some negative effects:
- Using too low zoom level - too much data is stored in each tile, which leads to poor performance.
- Using too high zoom level - large, simple features are split across an exaggerated number of small tiles, which leads to unnecessary large files and long processing time.
An example could be some very detailed building data for a city. If you try to import these into z10-z12, all the data will probably be pushed into a single, huge tile at z10. This would cause very poor performance in the finished map.
Overzoom
The overzoom function eases the zoom extent choice somewhat. It lets you display vector features at higher zoom levels than what they were created for. If you for example create a dataset at z10-z14, the default use of overzoom in M3 (6 levels) lets the data be visible all the way down to z20.
The downside with using overzoom is that performance will decrease as overzoom increases. The precision of the vertices of the vector data also decreases.
Starting import
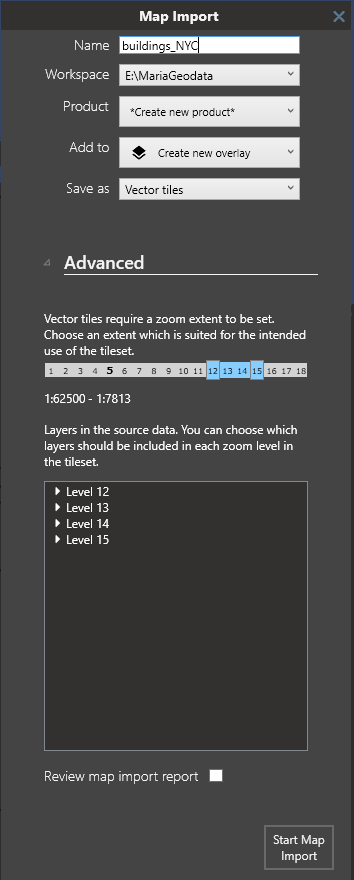
Choose the zoom extent with the two sliders. The zoom indicator shows the current zoom level in the map. Below, all the zoom levels in the zoom extent are listed. They can each be expanded, and you can uncheck layers that you don't need at that particular zoom level. By selecting Review map import report you can get an analysis of the file you created. Each zoom level will have a list of "concerns", indicating if there is too much data on that level. When you are satisfied with your settings, start the map import.
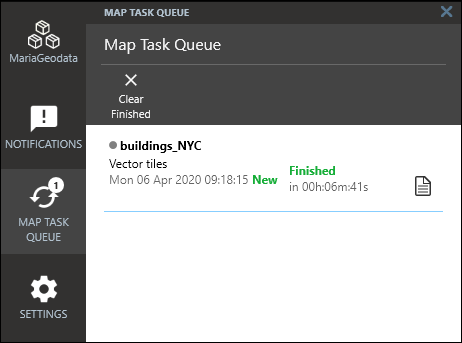
A map task will start, and you can monitor its progress in the Map Task Queue. If you selected Review map import report, you can click the "Report" icon.
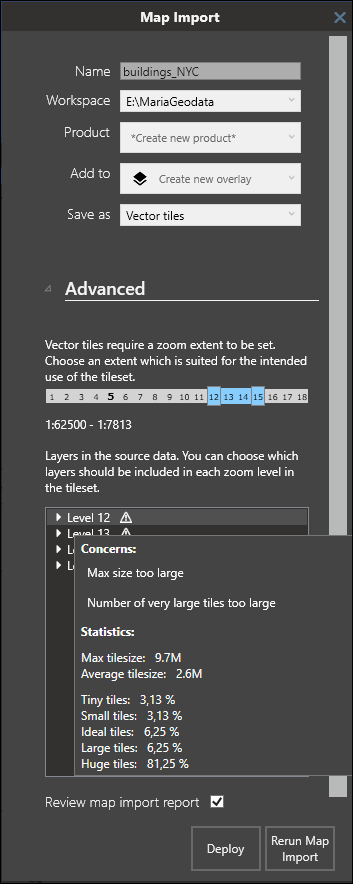
This will open the Map Import window again, but now an analysis has been performed on the vector tiles. You get the opportunity to re-run the translation process with different settings according to the analysis.
Mouse over each layer to read the result. Zoom levels with a ! have been determined to be sub-optimal. The messages from these will inform you of one of the following:
- Max size too large and Fraction/number of large tiles too high - You have put data which is too detailed into a zoom level which is too low. Each tile should ideally not be more than 0.1 MB. Depending on the size of the dataset, however, having a few tiles a little over 0.1 MB is not necessarily a problem. When many of them exceed 0.2 MB however, you should consider re-running the process with a higher minimum zoom level.
- Tiles contain little data - this is not as much of a problem as the opposite. The size of the data file will be larger than it could be, but performance will not be affected.
If you change any settings according to the analysis, you have to use Rerun Map Import, and the translation process will start over. If you use Deploy the map import will be finalized to your workspace as it is.


