MARIA GDK vector datasets
This article is valid for version 4.2 and older. For version 4.3, see Mapbox vector datasets
Importing data
When Maria Map Maker imports vector data, it is translated to Vector Tiles (.vtiles.sqlite). This is a very high-performant format, but the translation process requires some tuning and know-how to get the result you want.
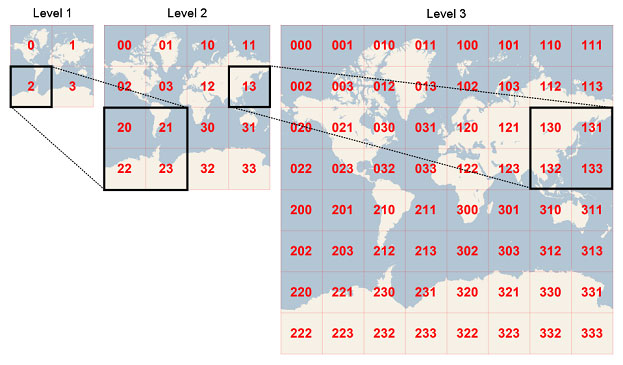
The Vector Tiles format splits the vector data into tiles, and puts each tile into a particular zoom level. Zoom level 0 is a single tile which covers the entire Earth (in Web Mercator projection). With every increasing zoom level, each tile is divided into four. As an example, zoom level 15 roughly equals map scale 1:15 000 at the equator. At this level the Earth is split into slightly more than a billion tiles.
When importing vector data to Vector Tiles, you need to decide which zoom levels (z) to create. This zoom extent is not possible to change later. The vector data simply does not exist on the levels outside the zoom extent you choose. This means that you have to be familiar with your source data and how they are going to be used. Using zoom levels which are not appropriate for the source data can have some negative effects:
- Using too low zoom level - too much data is stored in each tile, which leads to poor performance.
- Using too high zoom level - large, simple features are split across an exaggerated number of small tiles, which leads to unnecessary large files and long processing time.
An example could be some very detailed building data for a city. If you try to import these into z10-z12, all the data will probably be pushed into a single, huge tile at z10. This would cause very poor performance in the finished map.
For information about the accuracy of vector tiles at a given zoom level, see the article Vector tiles accuracy
Overzoom
The overzoom function eases the zoom extent choice somewhat. It lets you display vector features at higher zoom levels than what they were created for. If you for example create a dataset at z10-z14, the default use of overzoom in M3 (6 levels) lets the data be visible all the way down to z20.
The downside with using overzoom is that performance will decrease as overzoom increases. The precision of the vertices of the vector data also decreases.
Starting import
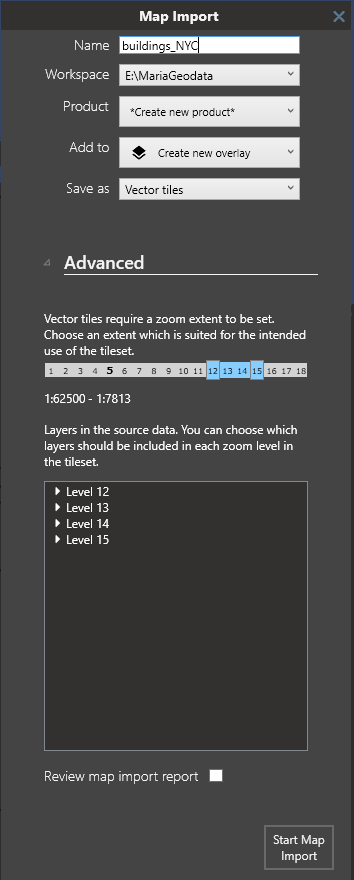
Choose the zoom extent with the two sliders. The zoom indicator shows the current zoom level in the map. Below, all the zoom levels in the zoom extent are listed. They can each be expanded, and you can uncheck layers that you don't need at that particular zoom level. By selecting Review map import report you can get an analysis of the file you created. Each zoom level will have a list of "concerns", indicating if there is too much data on that level. When you are satisfied with your settings, start the map import.
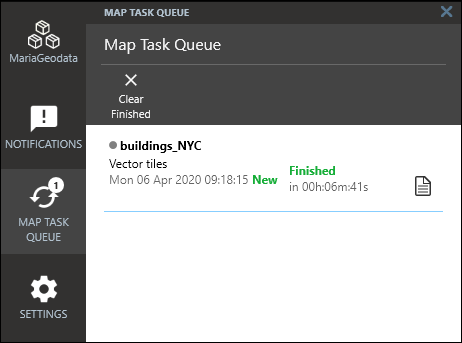
A map task will start, and you can monitor its progress in the Map Task Queue. If you selected Review map import report, you can click the "Report" icon.
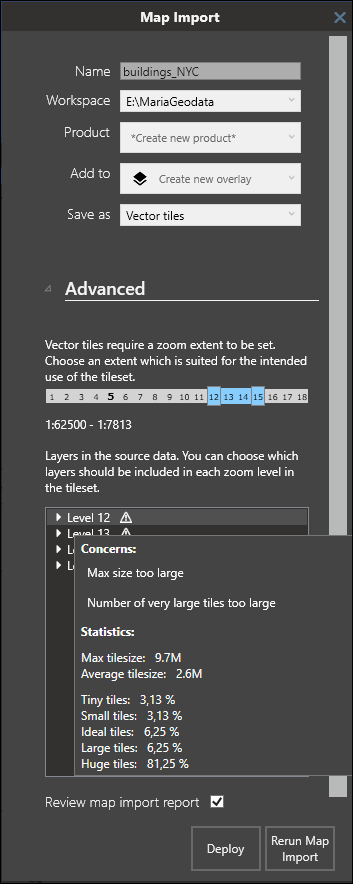
This will open the Map Import window again, but now an analysis has been performed on the vector tiles. You get the opportunity to re-run the translation process with different settings according to the analysis.
Mouse over each layer to read the result. Zoom levels with a ! have been determined to be sub-optimal. The messages from these will inform you of one of the following:
- Max size too large and Fraction/number of large tiles too high - You have put data which is too detailed into a zoom level which is too low. Each tile should ideally not be more than 0.1 MB. Depending on the size of the dataset, however, having a few tiles a little over 0.1 MB is not necessarily a problem. When many of them exceed 0.2 MB however, you should consider re-running the process with a higher minimum zoom level.
- Tiles contain little data - this is not as much of a problem as the opposite. The size of the data file will be larger than it could be, but performance will not be affected.
If you change any settings according to the analysis, you have to use Rerun Map Import, and the translation process will start over. If you use Deploy the map import will be finalized to your workspace as it is.
Styling
Setting up and styling vector data is by far the most complex operation when composing a map. When the source data is well described with attributes, the possibilities are quite endless.
You can reach the vector editing tools by fully expanding a vector layer. When a vector dataset is imported, there will be a one-to-one correspondence between the layers in the source and the layers in the finished map signature. Each layer will be assigned a random style by default.
Sub-layers
You can select multiple layers with the Ctrl key and toggle their visibility. As with the top-level layers, the layer on top of the list will be drawn on top in the map, and you can change drawing order by dragging and dropping. You can also control the scale limits of each layer. However, the scale limits of its parent will take precedence.
Right-clicking a layer lets you create new sub-layers or delete existing ones. You can also create new layers by right-clicking the dataset (the second level from the top).
Attributes
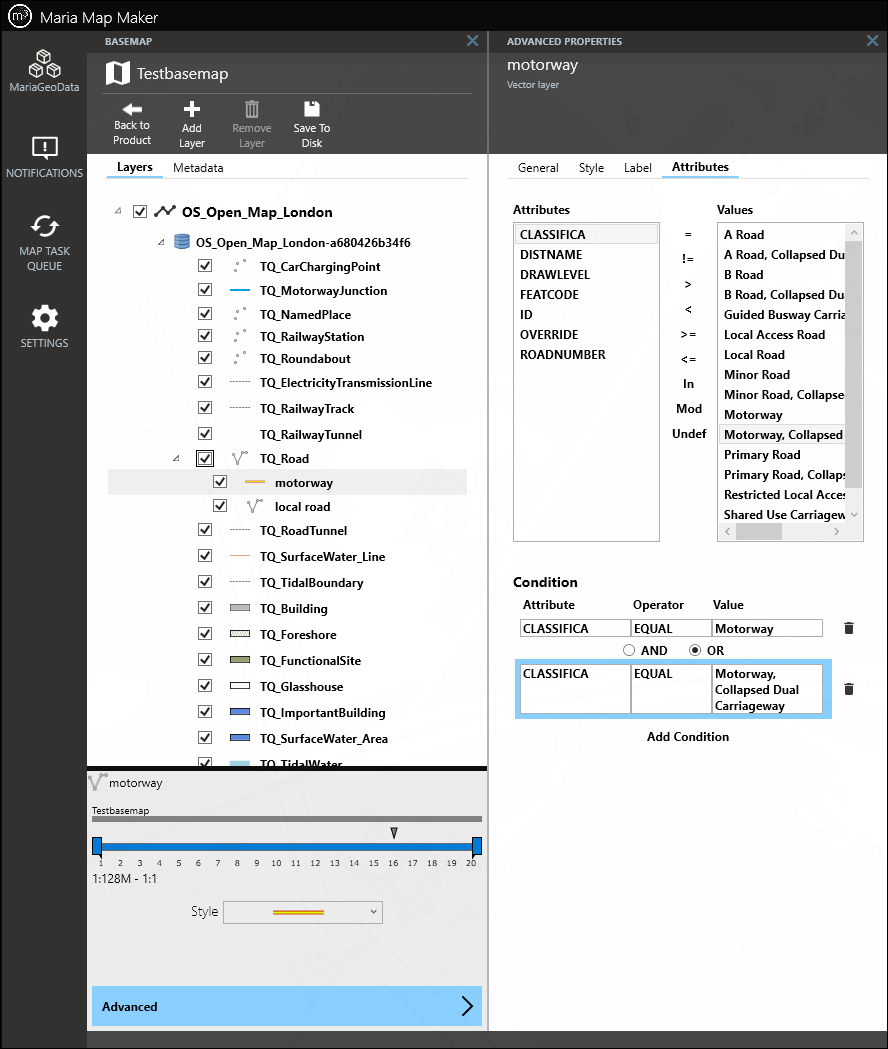
Open the advanced properties window and go to the Attributes tab. Here, you can get an overview of the attributes contained in the layer. You can also use the attributes to create conditions to filter geographic features.
The Attributes list shows all the attributes contained in the layer. Clicking one of them will show a sample of possible values for this attribute.
Below this, you can add one or more conditions. Make sure that the empty, default condition is selected, and you can then click a combination of attribute, operator and value. It's possible to manually type in a value if you can't find it in the Values list. If you add more than one condition, select either of the logical operators AND/OR to connect them. If you select the Mod (Modulo) operator, then the left part of the value field should have the divisor and the right should have the remainder. The Undef (Undefined) operator is satisfied if the attribute does not exist.
Labels
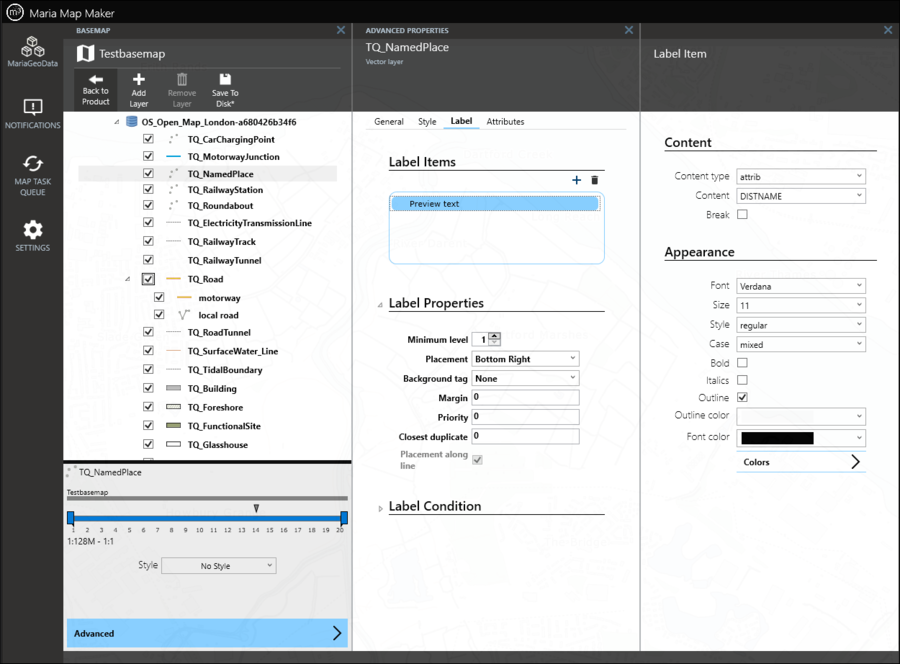
Each layer can have one or more labels. When you open the Label tab, use + to add a new label item. In the Label Item window, you start by selecting the content for the label, either an attribute or a static string. Below, in the Appearance section, there are a number of settings which control how the label text is drawn.
Back in the main Label tab, in the Label Properties section there are a also a few settings. These will affect all the label items. The Label Condition section lets you set conditions similarly to the Attributes tab. These conditions decide if the label is drawn or not.
It is possible to apply labels to all vector layer types (area, line, point). However, automatically placing labels on area features is hard to do well, especially with tiled vector data. For this reason, it is recommended that you make sure that the source data use point features for labelling if possible. This makes the placement of the labels much more predictable.
Style tab
The Style tab lets you create rules for how the vector data is displayed in the map.
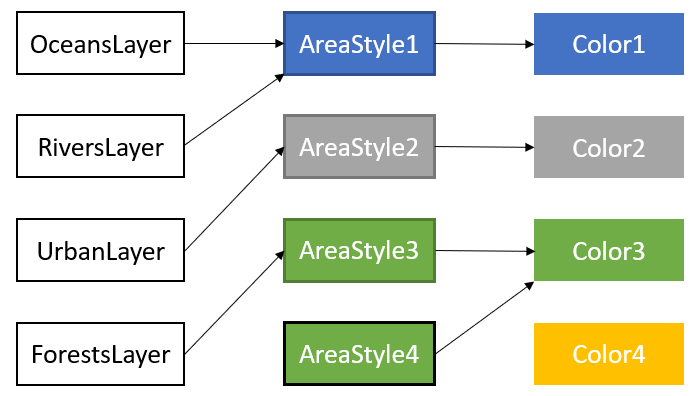
Styling vector layers in M3 will be familiar to anyone who's used a GIS before, but there is one thing which might different from what you're used to. We have a collection of layers and a collection of styles, and each layer can have a reference to one of the styles. Several layers can reference the same style. This means that if you change a style, all the layers referencing it will change appearance accordingly.
In the same way, there is a collection of colors which is referenced in the styles. If you change a color which is referenced in several styles, all the styles (and again all the layers) change accordingly.
This way of separating layers, styles and colors lets you re-use the combinations you create, and can save some work. If you find it confusing however, you can just create individual styles and colors for each layer, so that there is no overlap.
All layers can be set to "No style", and the layer data will not be drawn. Any labels will still be visible though.
Points
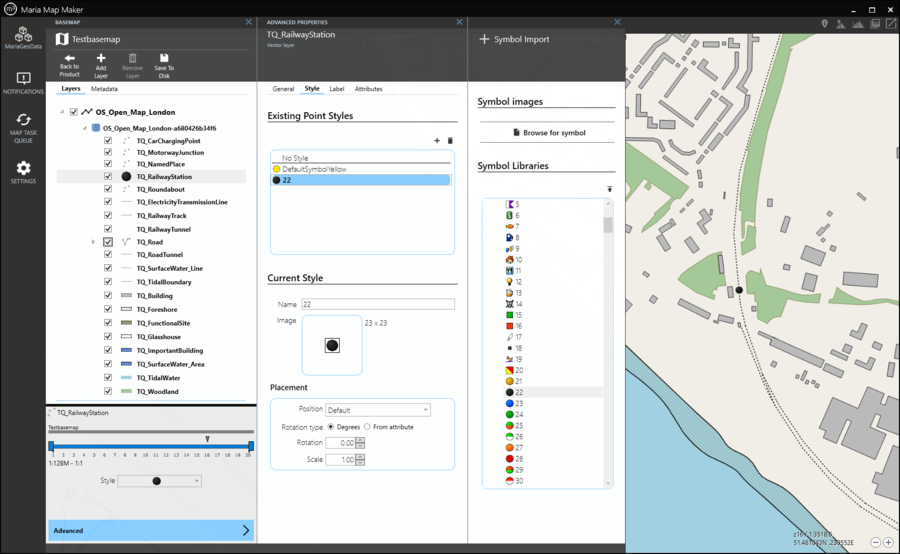
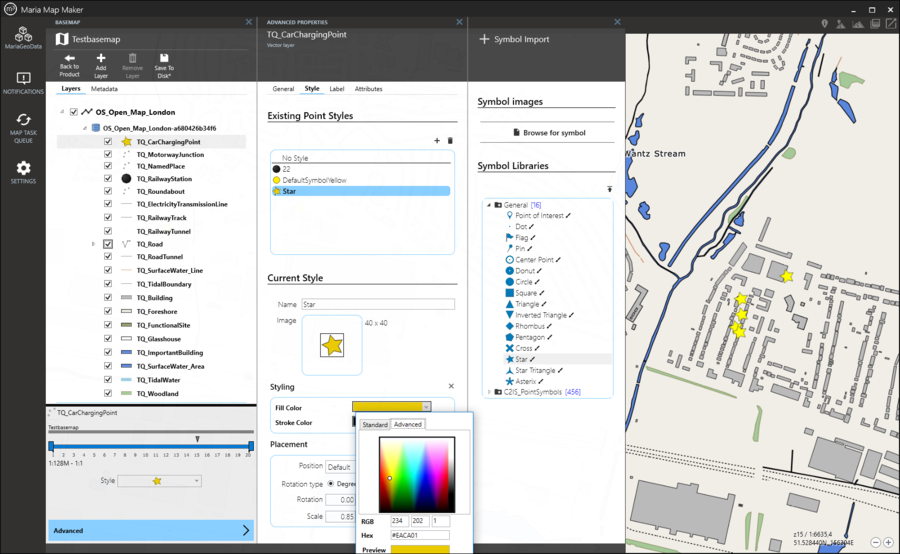
When vector datasets are created, a simple, default point symbol is included. This will be listed under Existing Point Styles. Double-click a symbol to select it for the current layer. Right-click to get additional options to duplicate or remove a symbol from the dataset.
Clicking an existing point style lets you adjust several placement options:
- Position - how to define the symbol position in relation to the point feature in the data.
- Rotation - rotate the symbol, either by a specified number of degrees, or by a number from an attribute.
- Scale - specify a decimal number with which to scale the symbol.
Symbol point libraries
You can import additional symbols from a symbol point library, which is included with the M3 installation. To open the Symbol Import window, click +. Here, you can import a library symbol into your dataset by double-clicking it. You can also browse to a PNG file on the computer.
In addition to PNG, point libraries also support the Scaled Vector Graphics (SVG) format. This format can be set up to have elements which can be styled by the user. These types of symbols will have a brush icon ![]() next to it in the library list. When it's imported into the dataset, the style options will be available.
next to it in the library list. When it's imported into the dataset, the style options will be available.
Lines
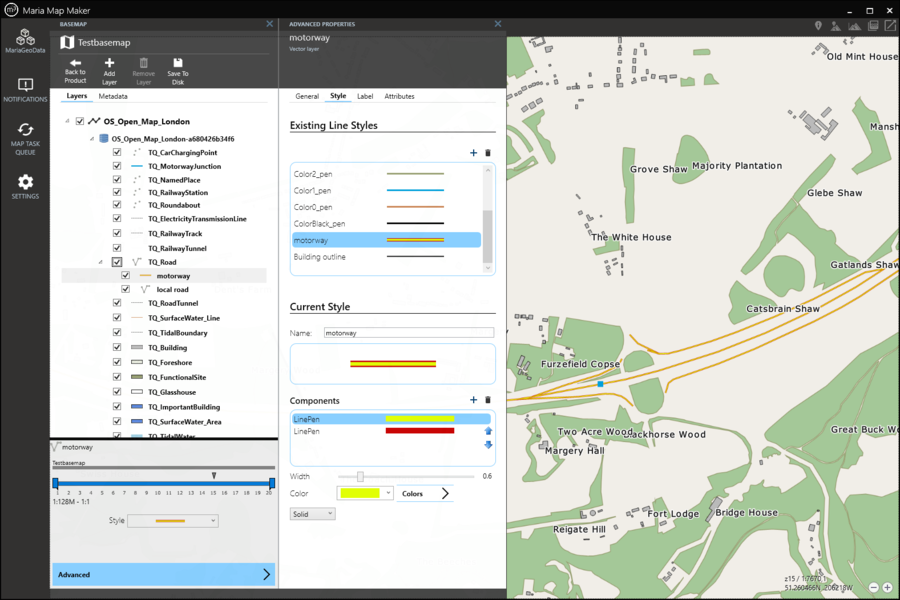
Existing Line Styles is the collection of line styles which are already defined. You can create and delete styles using the symbols to the top right of the list. Selecting one of the styles will make it the active style for the current layer. It also brings it up in the Current Style section below.
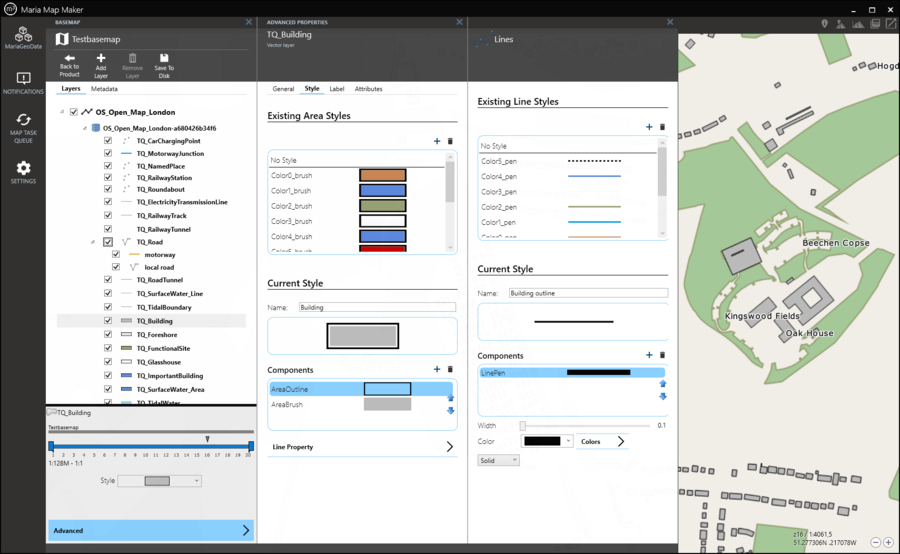
Each line style consists of one or more Components. You can add several lines of different Width and Color, which will be drawn on top of each other (use the arrows to change drawing order).
A line component can also have Dashes. In this case, a sliders will appear to let you control the length of the Dashes and the length of the Gaps between them. The actual appearance in the map will depend on the width of the line component itself, so you will have to experiment a bit to get the look you want.
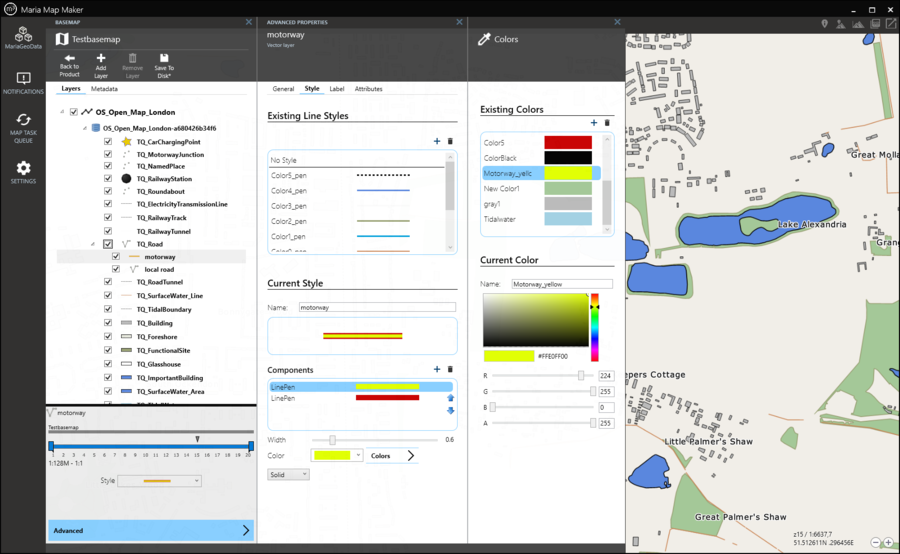
For color you can either select one of the pre-defined colors from the drop-down menu, or you can use the Colors button to open a new window where you can create, delete and edit colors from the collection.
Areas
Styling areas is similar to lines. In each style you can add an AreaBrush (fill) component. The brush must be paired with one of the defined colors. You can also choose a Pattern, such as solid, horizontal or vertical lines, cross-hatch and more.
For the AreaOutline component, you choose a defined line style.
For the Symbol component you select one of the defined point styles. The map renderer will then attempt to draw this symbol at regular intervals on the area features.
For the Bitmap brush component you use custom PNG files from the FillPatterns folder. The map renderer will then tile the area feature with this PNG file.
Colors
The Colors window is used when you want to edit the collection of defined colors. You reach it through the style tab of line and area layers, and in the label window.
You can create, delete and edit colors in the same way as with line and area styles. When a color is selected you can use the widget to visually select a color, or you can input hex or RGBA color codes.
